
FIGURE 3.
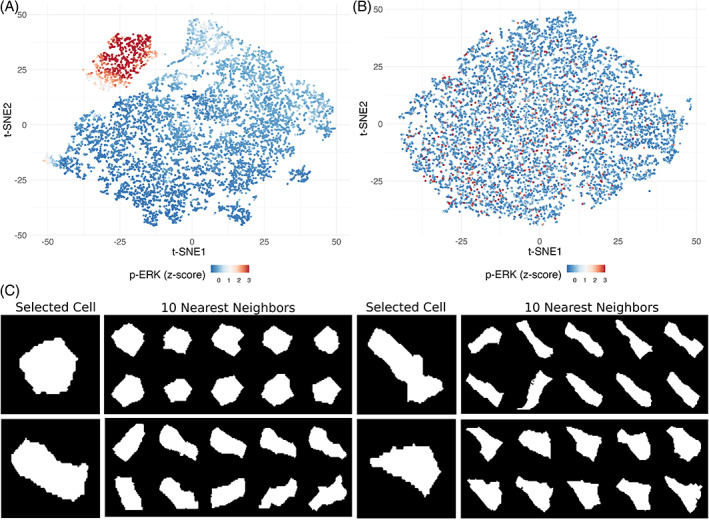
Cell shape similarity. t‐SNE plots using (A) only marker intensity and (B) cell shape latent vectors are shown with p‐ERK staining intensities. (C) The shapes of four selected cells are compared to their 10 nearest neighbors in t‐SNE space
Official websites use .gov
A
.gov website belongs to an official
government organization in the United States.
Secure .gov websites use HTTPS
A lock (
) or https:// means you've safely
connected to the .gov website. Share sensitive
information only on official, secure websites.
Cell shape similarity. t‐SNE plots using (A) only marker intensity and (B) cell shape latent vectors are shown with p‐ERK staining intensities. (C) The shapes of four selected cells are compared to their 10 nearest neighbors in t‐SNE space