Fig. 4.

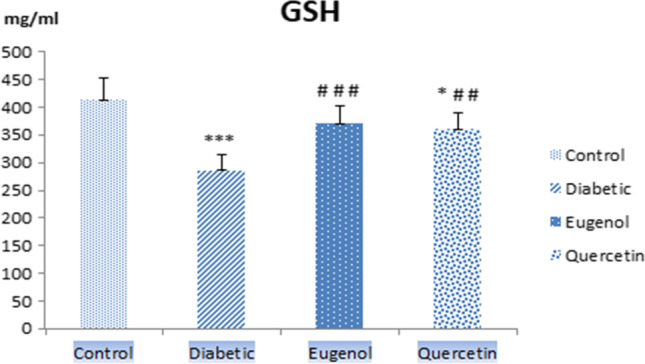
Serum GSH levels of control, diabetic, eugenol and quercetin groups. Data were expressed as mean ± standard deviation (SD) (n = 7). *p < 0.05, ***p < 0.001 vs control, ##p < 0.01, ###p < 0.001 vs diabetic

Serum GSH levels of control, diabetic, eugenol and quercetin groups. Data were expressed as mean ± standard deviation (SD) (n = 7). *p < 0.05, ***p < 0.001 vs control, ##p < 0.01, ###p < 0.001 vs diabetic