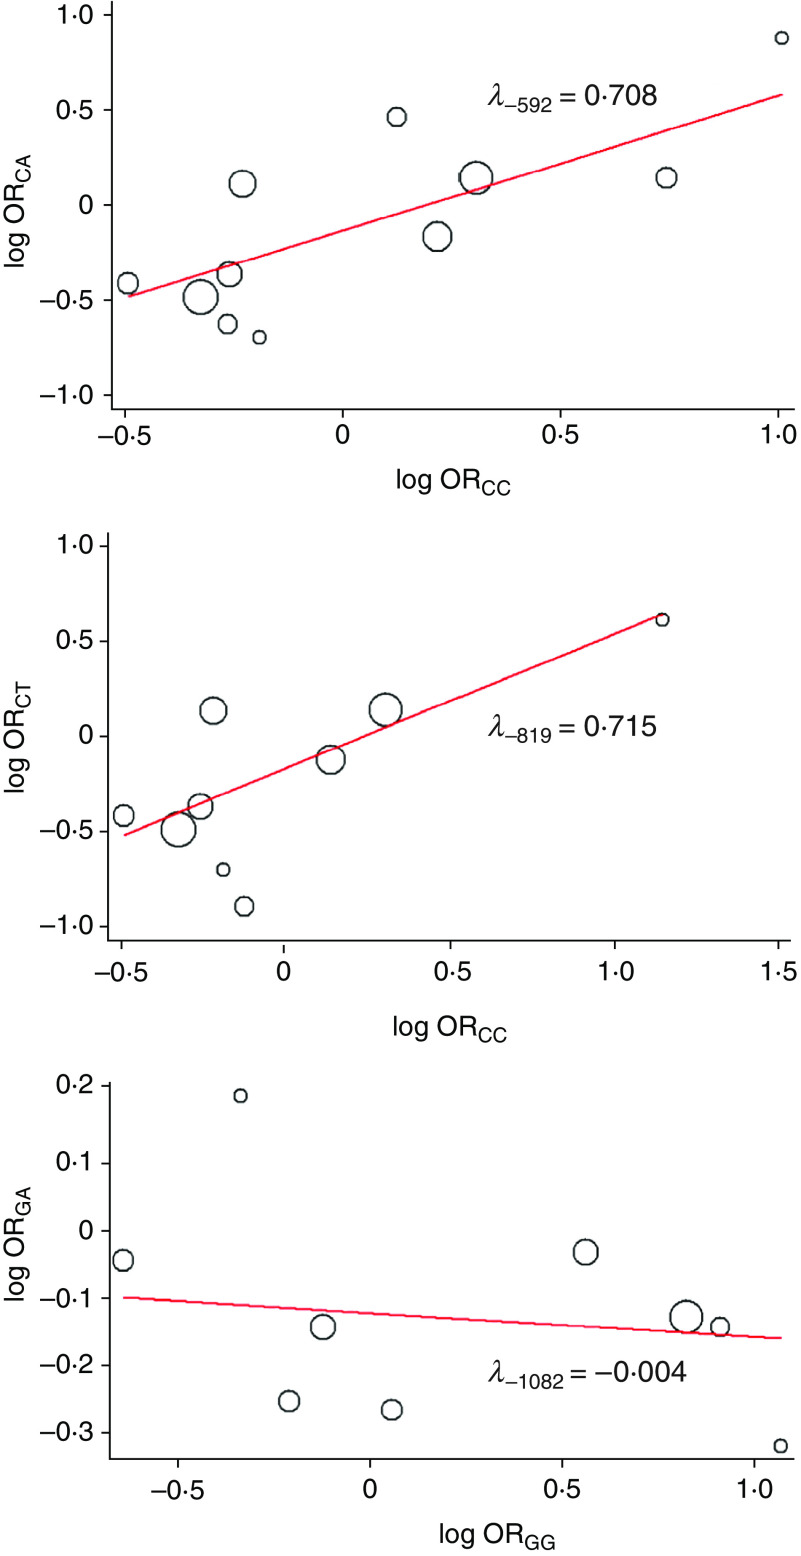
Fig. 1.
[colour online]. Plots of log odds ratio (OR)CA against log ORCC (−592C/A), log ORCT against log ORCC (−819C/T) and log ORGA against log ORGG (−1082G/A) for IL-10 polymorphisms and risk of HCV infection. The slope of the solid line represents λ and size of circular symbols denotes the weight of study.

