
Figure 1. Joint Admixture Mapping analyses.
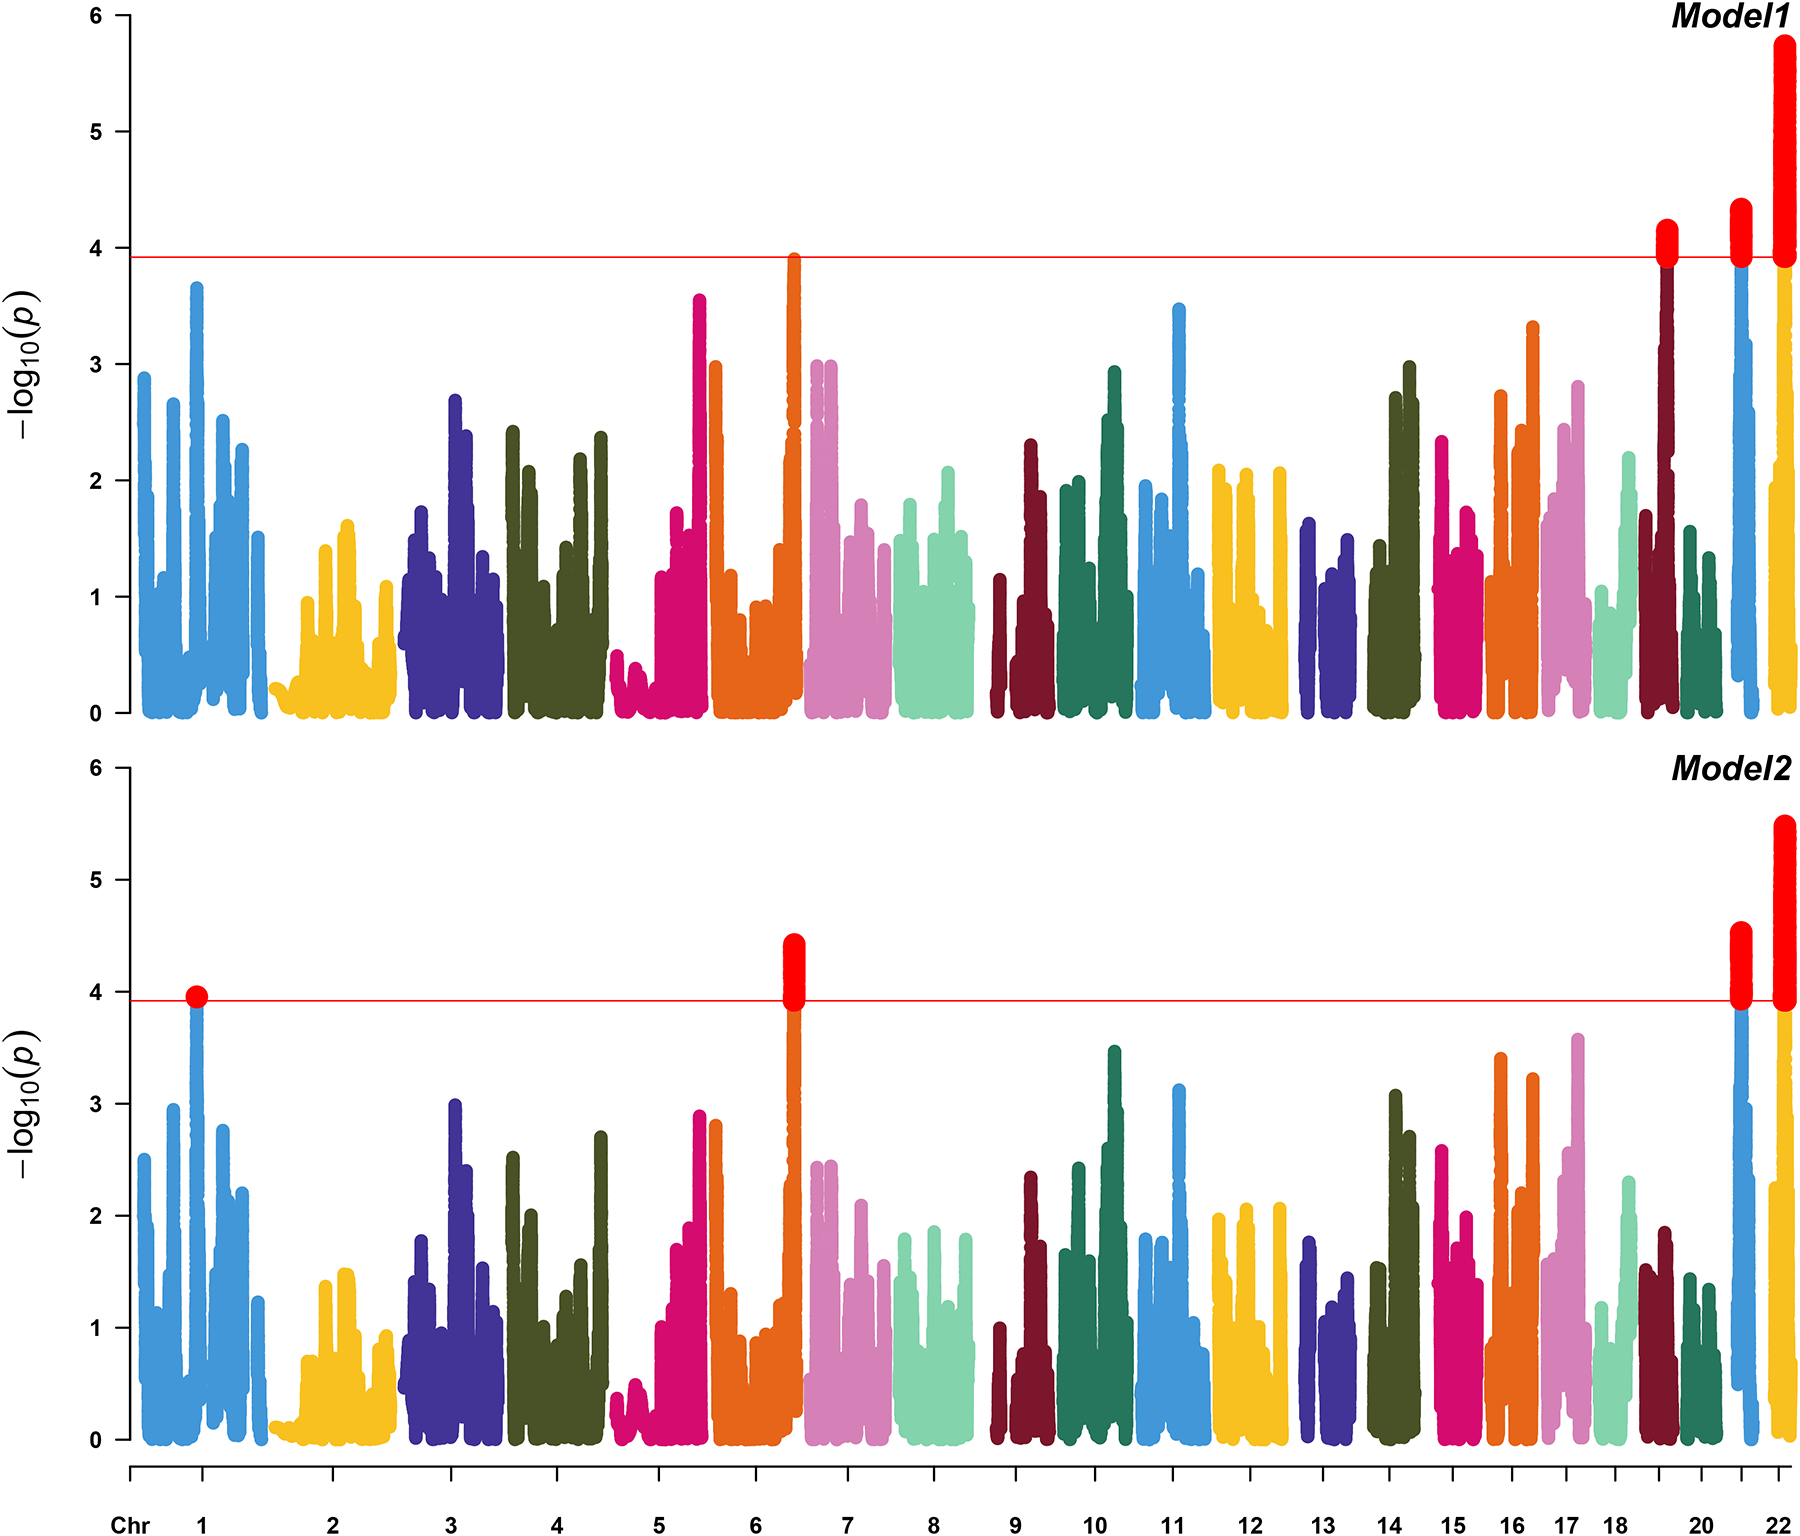
Manhattan plots of analyses conducted in admixMap (Model 1 (upper panel): LOAD~sex+age+genotype batch+PCs+kin; Model 2 (lower panel): LOAD~sex+age+genotype batch+APOE-e4+PCs+kin)
Official websites use .gov
A
.gov website belongs to an official
government organization in the United States.
Secure .gov websites use HTTPS
A lock (
) or https:// means you've safely
connected to the .gov website. Share sensitive
information only on official, secure websites.
Manhattan plots of analyses conducted in admixMap (Model 1 (upper panel): LOAD~sex+age+genotype batch+PCs+kin; Model 2 (lower panel): LOAD~sex+age+genotype batch+APOE-e4+PCs+kin)