
Figure 3. GCAT protein is dysregulated in Late Onset Alzheimer’s Disease.
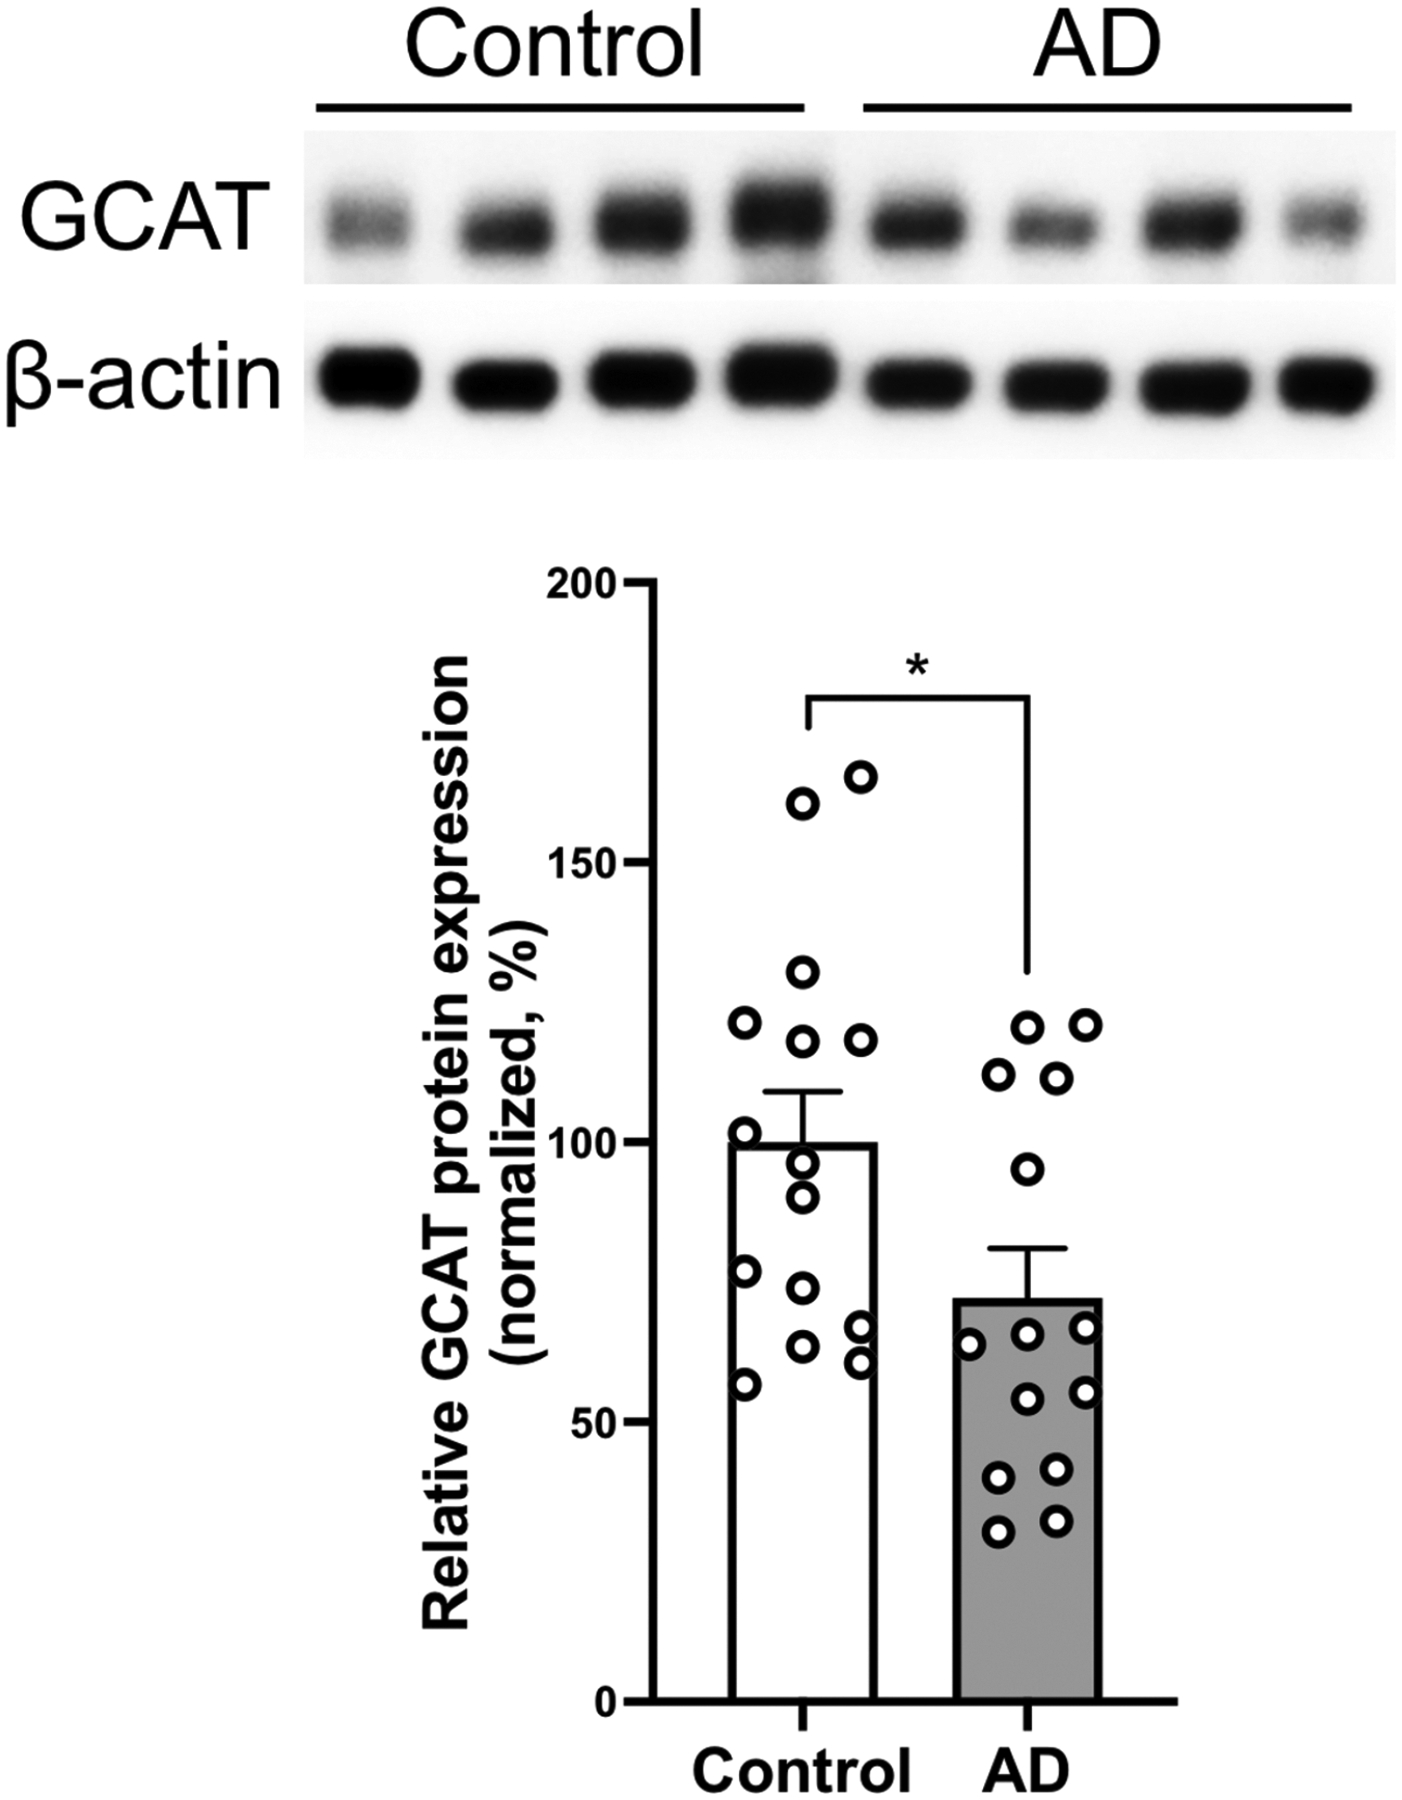
Western blot quantification of GCAT protein levels in human prefrontal cortex of controls (n = 15) and AD (n = 14). Top portion of the panel shows representative Western blots. Histograms show densitometric quantification of GCAT protein abundance with respect to control at the bottom of the panel. GCAT is normalized by β-actin in all samples. Mann Whitney U Test; * p-value=0.038. Data represent mean ± SEM.