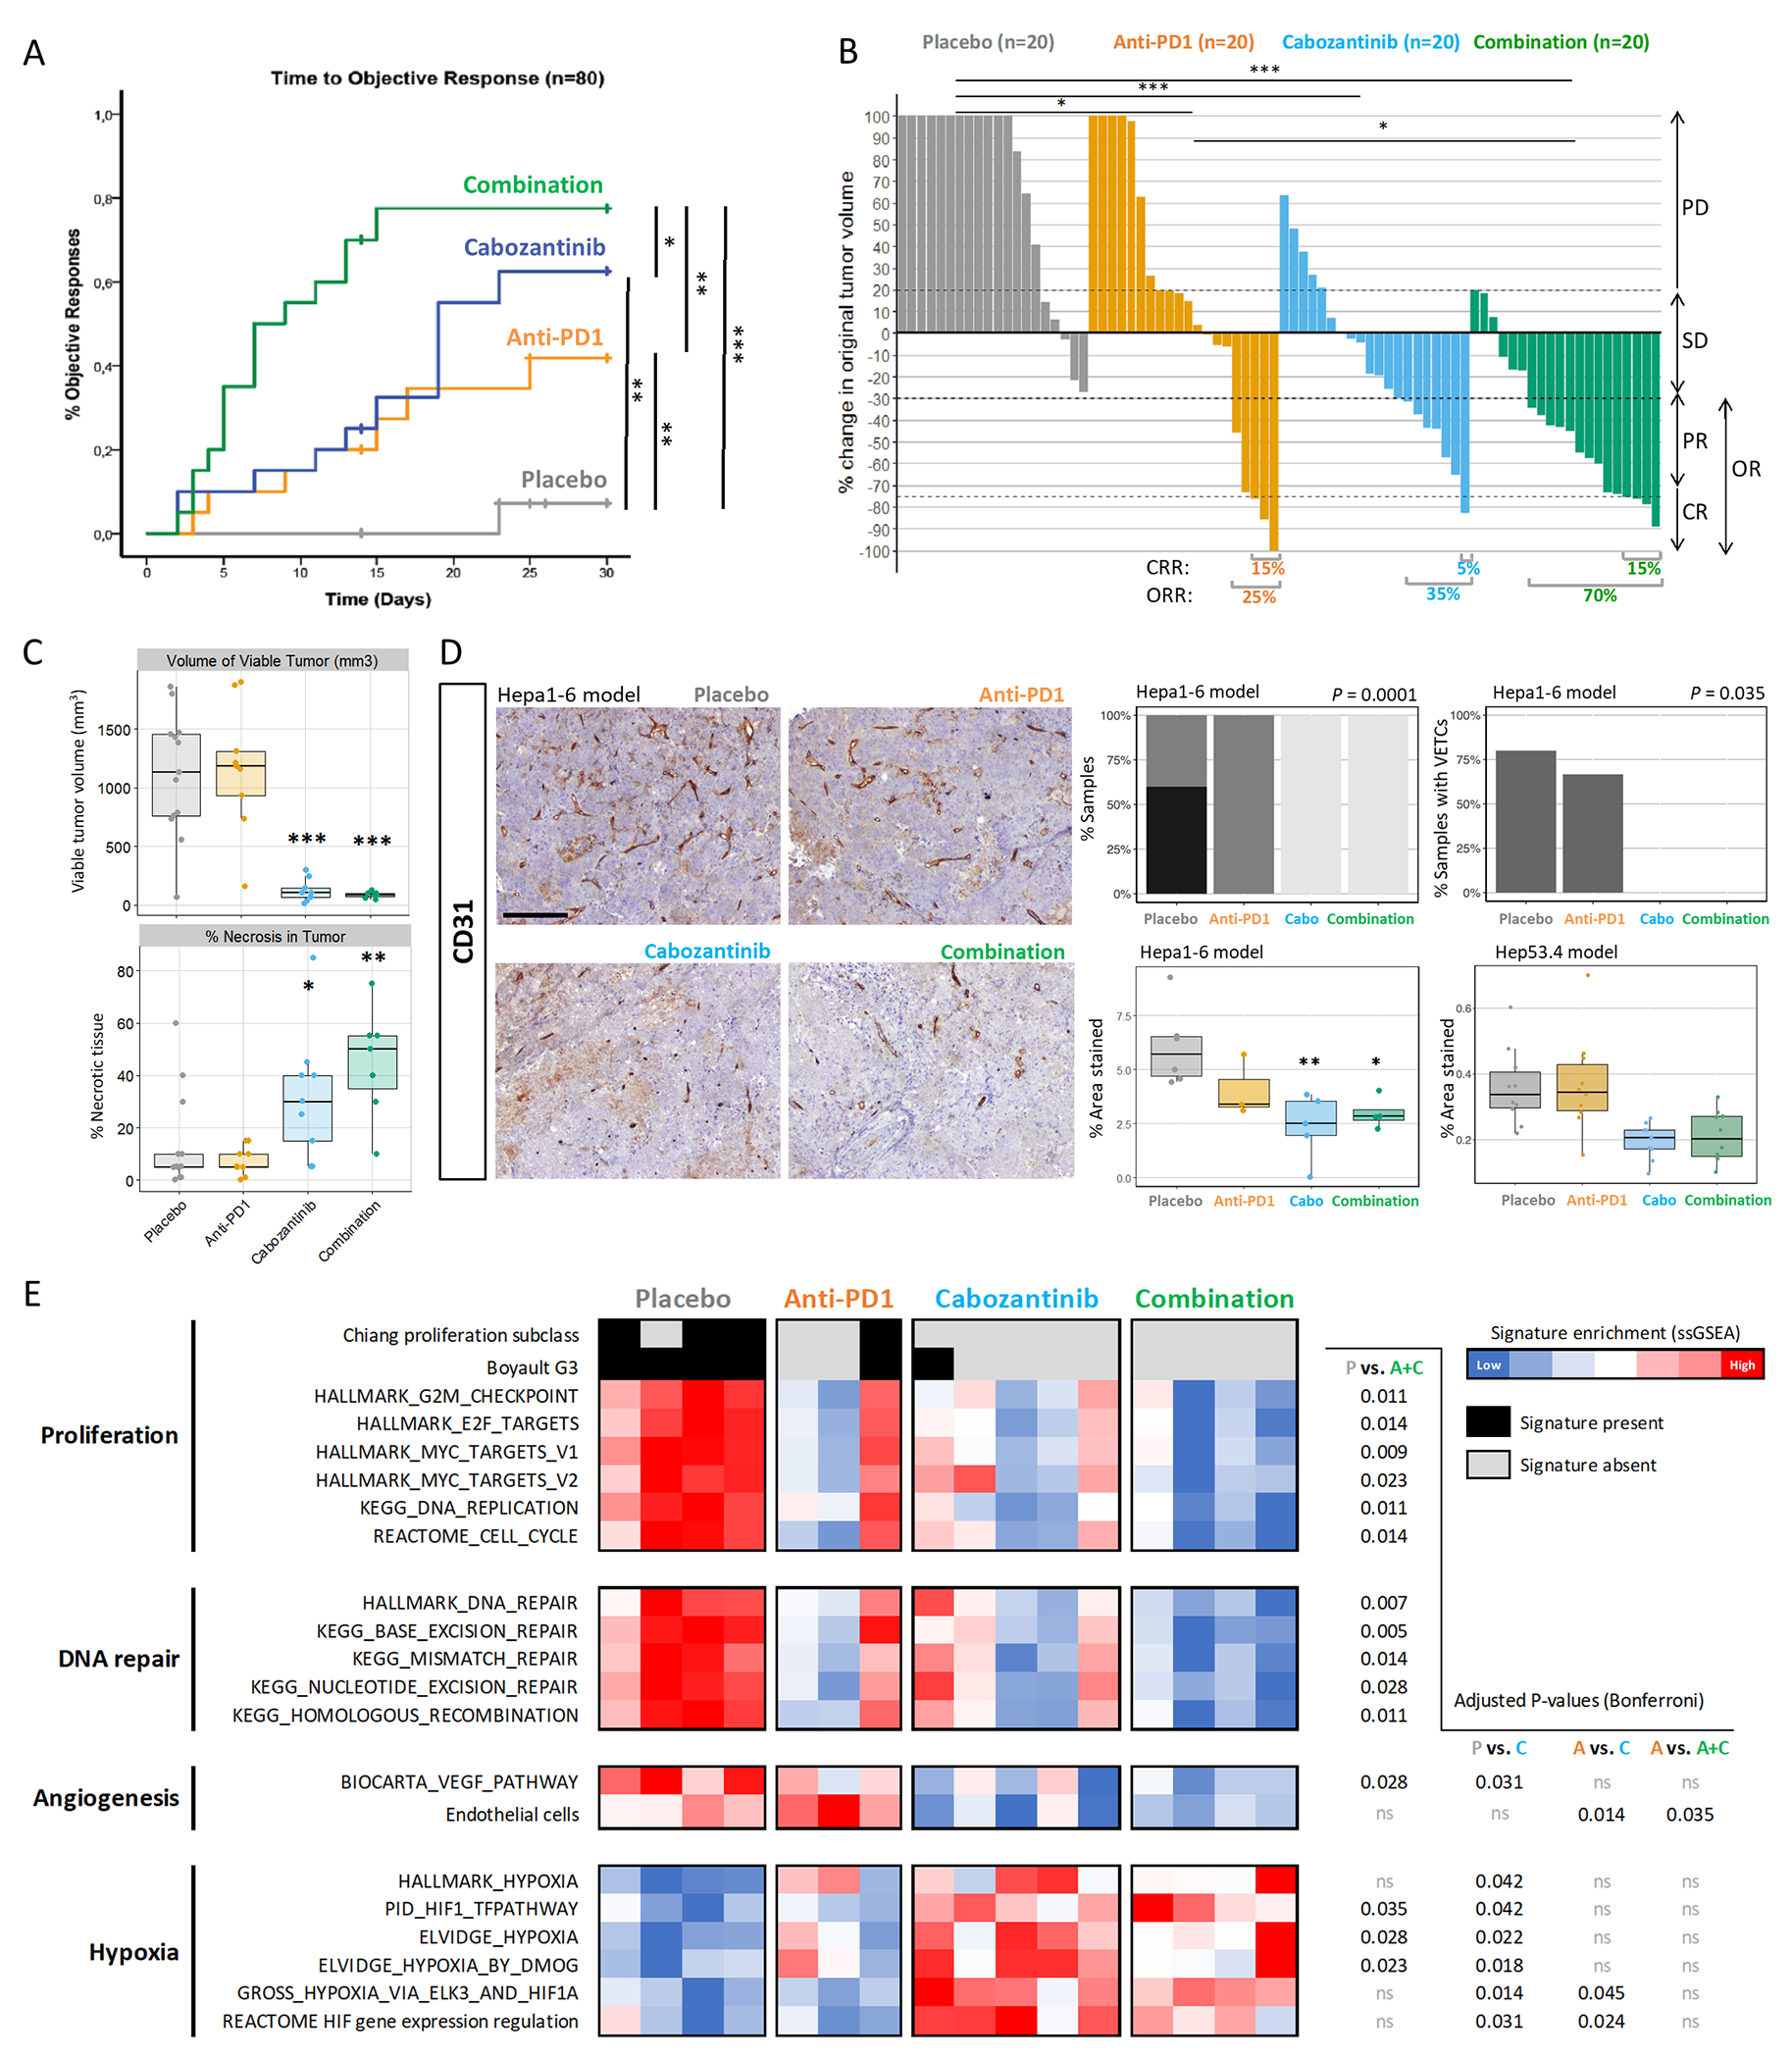
Figure 1 |. Cabozantinib + anti-PD1 has a strong anti-tumour activity and promotes vascular normalisation in a murine HCC model.

C57BL/6J mice bearing Hepa1-6 tumours were treated with anti-PD1 or placebo IgG ± oral cabozantinib (n=20 mice per arm). A. Time taken to achieve an objective response (Log-Rank test P-values depicted). B. Waterfall plot of tumour response at day 14 according to RECIST criteria (Fisher’s exact test P-values depicted). N.B. The Y-axis is capped at +100% and therefore only the first doubling in tumour volume is accurately depicted. PD = progressive disease, SD = stable disease, PR = partial response, CR = complete response, OR = objective response. C. Volume of viable tumour (mm3) and % of tumour necrosis from tumours at day 32 (compared vs. placebo). D. Representative images of CD31 staining across the four treatment groups, 100x magnification (left panel, scale bar = 200 μm). Plots on the right panel depict the proportion of samples with mild, moderate or marked CD31 staining, the quantification of tumour vascular endothelial cells stained with CD31 (compared vs. placebo, and validation in the Hep53.4 model), and the percentage of samples with vessels encapsulating tumour clusters (VETCs). Images taken at 100x magnification. Scale bar = 200 μm. E. Heatmap reflecting enrichment in signatures of proliferation, DNA repair, angiogenesis and hypoxia obtained through NTP and ssGSEA. * P<0.05, ** P<0.01, *** P<0.001, ns P>0.05.
