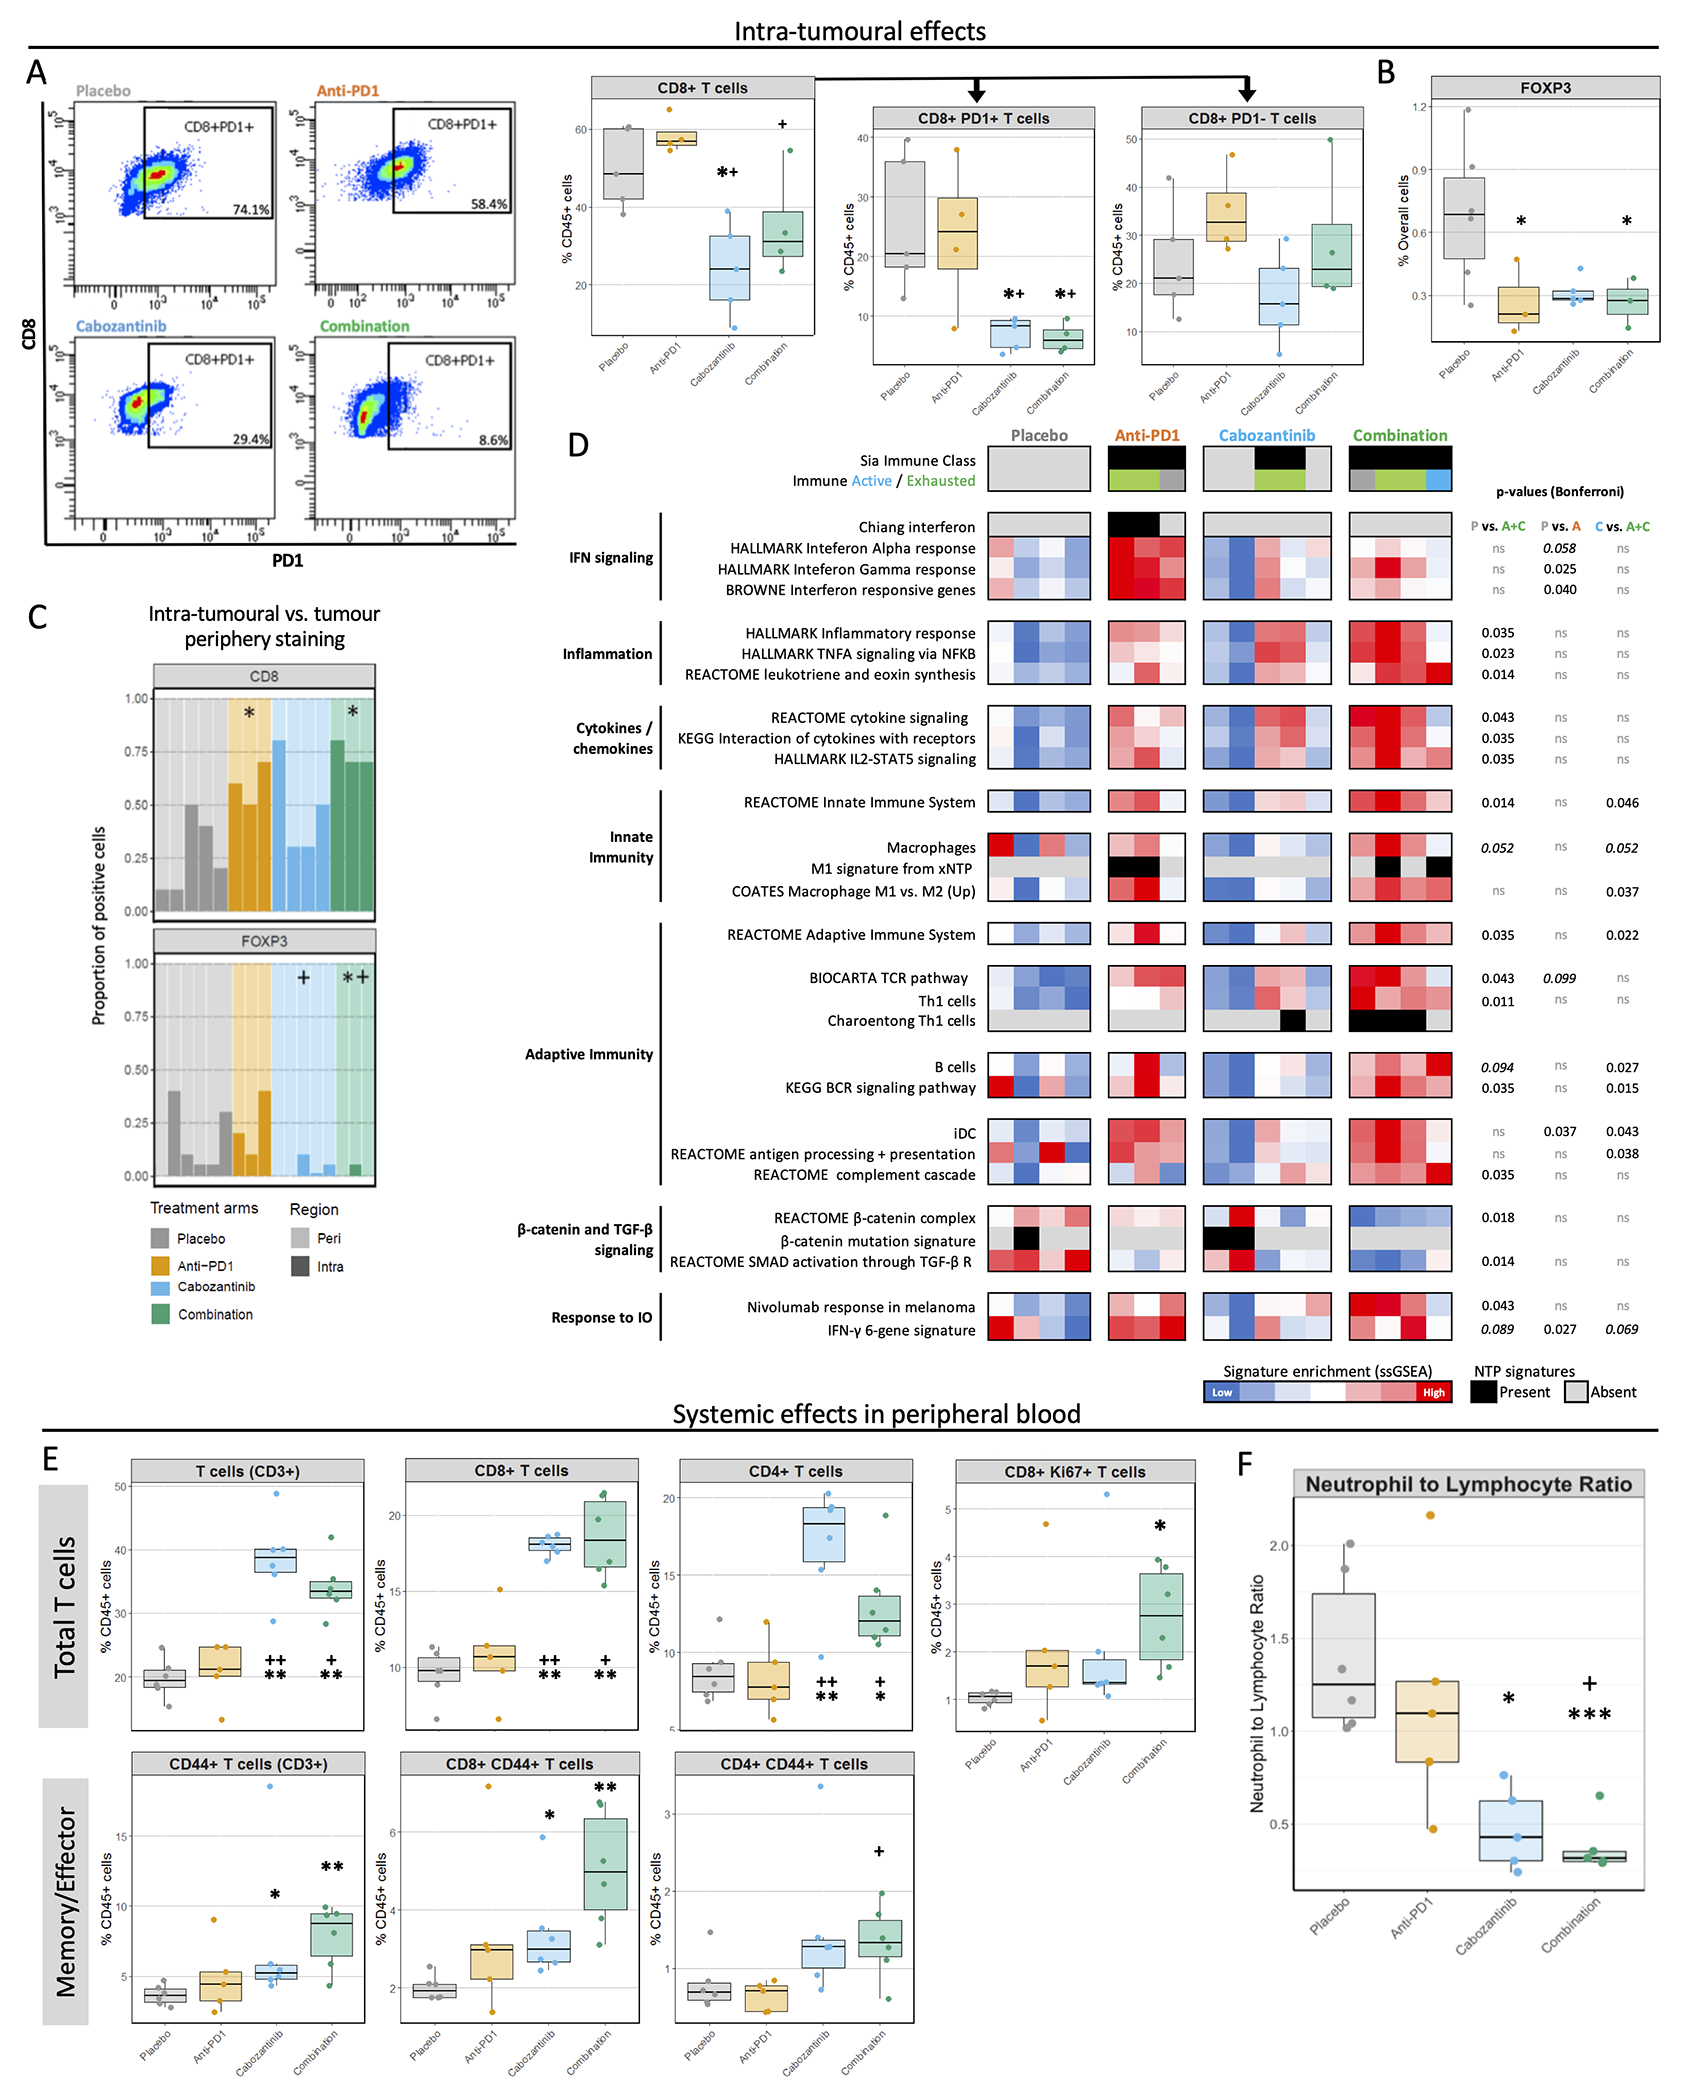
Figure 3 |. Cabozantinib + anti-PD1 therapy induces a strong pro-inflammatory effect.

A. Representative dot plots showing PD1 gating among CD45+CD3+CD8+ cells (left), and proportions of intra-tumoural CD8+ T lymphocytes and their PD1+ and PD1− subsets as a % of CD45+ cells, as determined by flow cytometry (right). B. Mean percentage of FOXP3 positive cells in tumour parenchyma as determined by IHC using QuPath, relative to all cells. C. The proportion of total CD8 and FOXP3 staining in intra-tumoural or peripheral areas. Each bar represents a mouse, and the darker colour depicts which % of staining is intra-tumoural. D. Heatmap showing tumour immunity features. Gene signatures representing different states of inflammation, HCC subclasses or distinct immune cell populations were tested using NTP and ssGSEA. Bonferroni-corrected P-values from Dunn’s post-hoc test. E. Overall populations of T lymphocytes (CD3+), and specifically CD8+ T cells, CD4+ T cells and proliferating CD8+ T cells (defined as CD8+Ki67+) in peripheral blood after 14 days of treatment, and the proportions of the memory/effector subgroups within these populations (characterized by CD44 expression). F. The ratio of neutrophil to lymphocyte proportions in peripheral blood. * P<0.05 and FDR<0.1 compared to placebo; + P<0.05 and FDR<0.1 compared to anti-PD1. Data obtained from the Hepa1-6 model.
