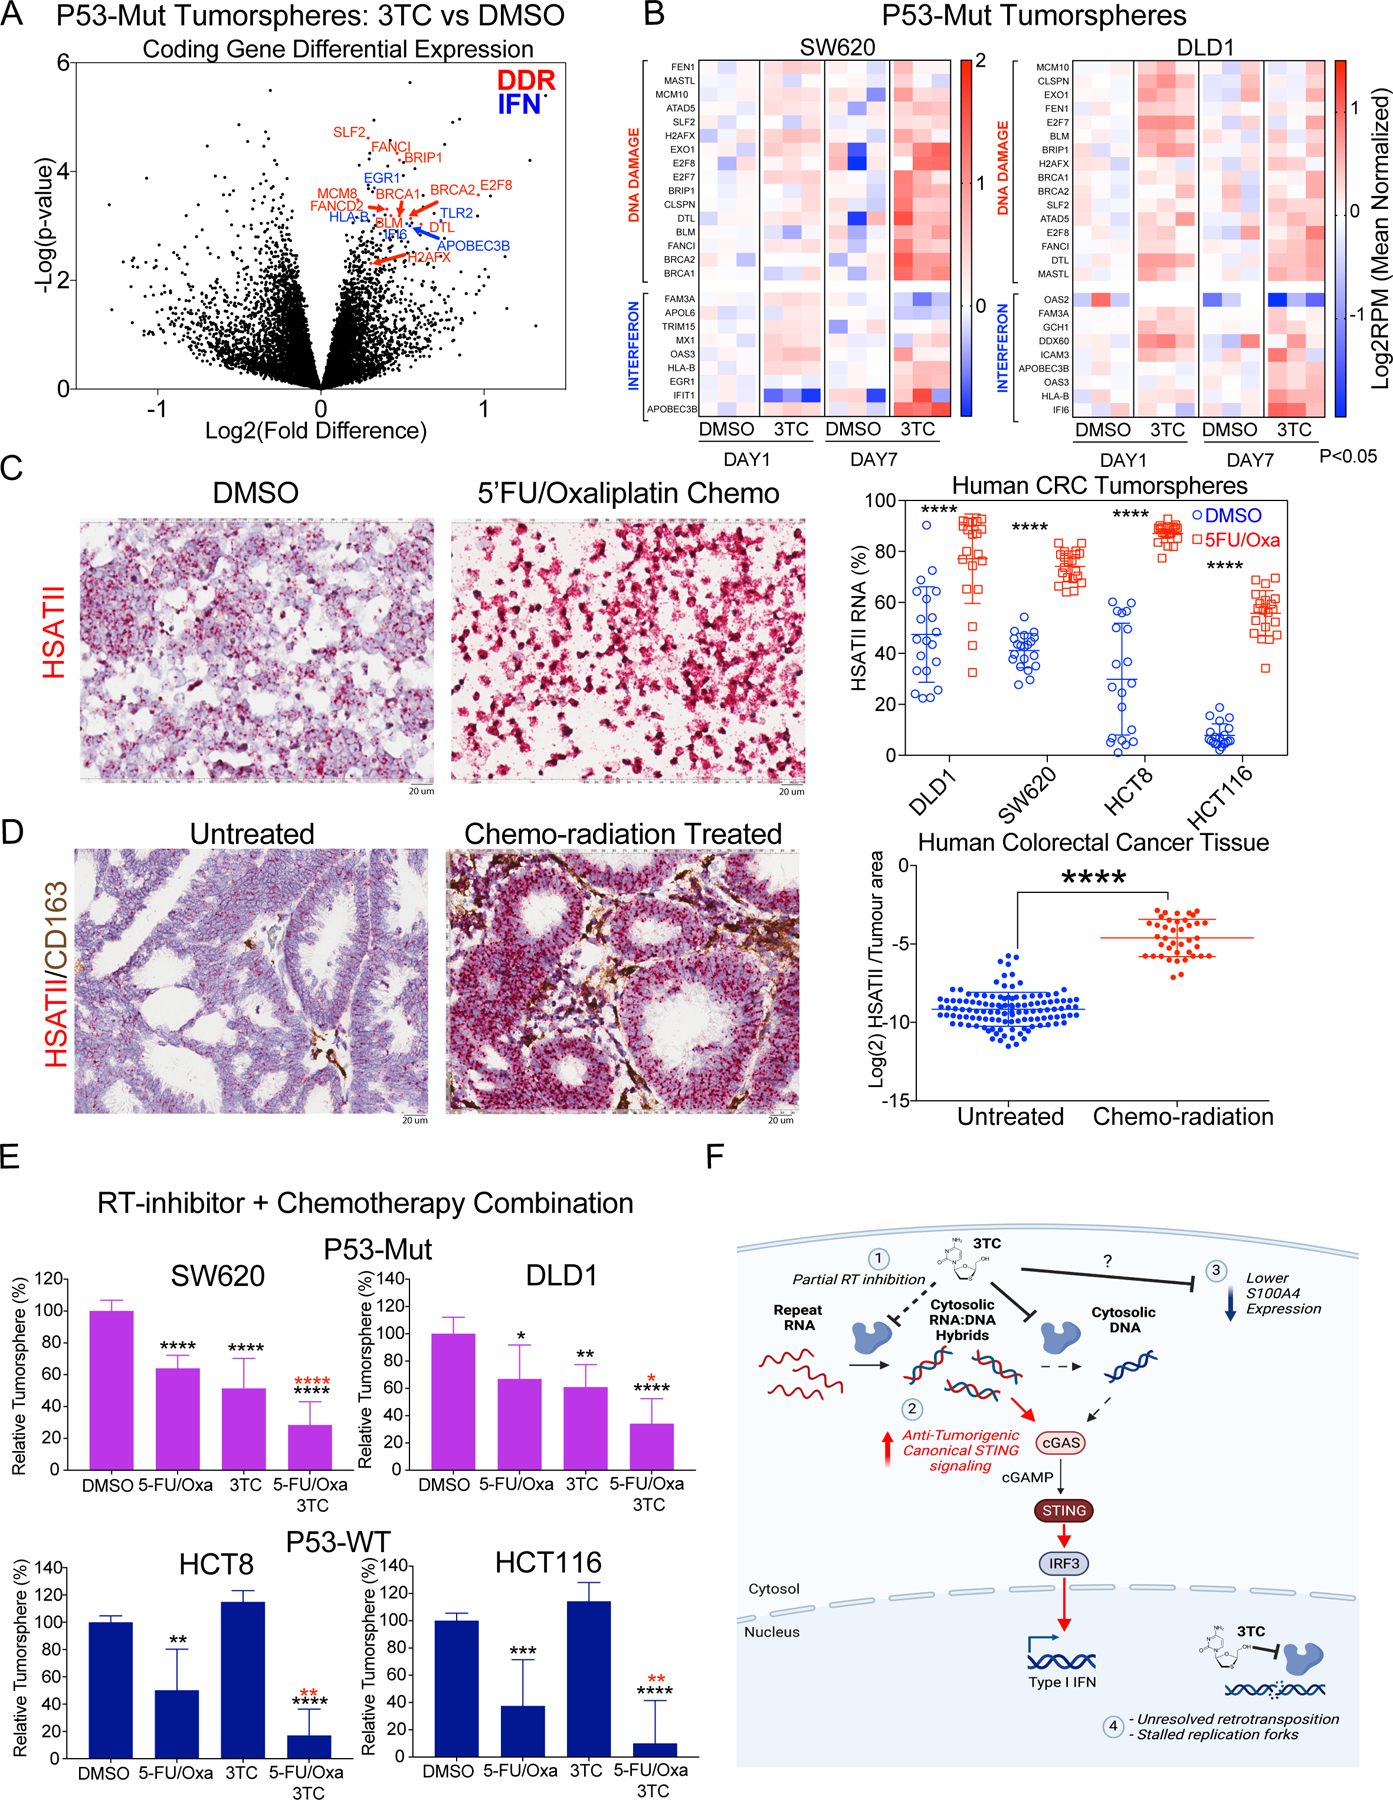
Figure 6. Reverse transcriptase inhibition induces DNA damage in colon cancer.

A, Volcano plot of coding gene RNAs with 3TC (5 µM) or DMSO treatment for 7 days in P53-Mut cell lines (DLD1 and SW620; n = 3 for 2 independent experiments per cell line). Highlighted are DNA Damage Response (DDR) and interferon/innate response (IFN) genes B, Tumorsphere RNA-seq expression heatmap of P53-Mut CRC cell lines for DDR and IFN genes at Day 1 and Day 7 post-3TC vs DMSO treatment. Expression is Log2RPM normalized to mean of DMSO per timepoint and cell line. Genes represented have significantly increased expression in response to 3TC at either Day 1, or Day 7, or both (P<0.05 student’s two-tailed t-test). C, HSATII expression in HCT8 tumorspheres grown in the presence of DMSO (control), or 50 μM 5FU + 1.25 μM Oxaliplatin (5FU/Oxa) for 2 weeks. Scale bar = 20 μm. HSATII RNA-ISH in DLD1, SW620, HCT8, and HCT116 tumorspheres treated with DMSO or 5FU/Oxa for 2 weeks. Plots represent HSATII staining as a percentage of tumor area across 20 fields. Significance determined by two tailed t-test with Welch’s correction: **** p < 0.0001. D, HSATII RNA-ISH on human CRC tumors from untreated patients (Left) and patients who received neoadjuvant chemoradiation (Right). Scale bar = 20 μm. HSATII RNA levels quantified as a percentage of tumor area. Significance determined by student’s two tailed t-test with Welch’s correction: **** p < 0.0001. E, Cell viability of CRC tumorspheres treated with either DMSO or 5 μM 3TC for 7 days in the presence of 5FU/Oxa. Significance determined by student’s two tailed t-test: * p < 0.05, ** p < 0.01, *** p < 0.001, **** p < 0.0001. Black stars indicate statistical significance compared to DMSO alone. Red stars indicate statistical significance compared to 5FU/Oxa. F, Schematic of multiple effects of 3TC on colorectal cancer including alterations in cytosolic nucleic acids (1 & 2), S100A4 expression (3), and DNA damage (4).
