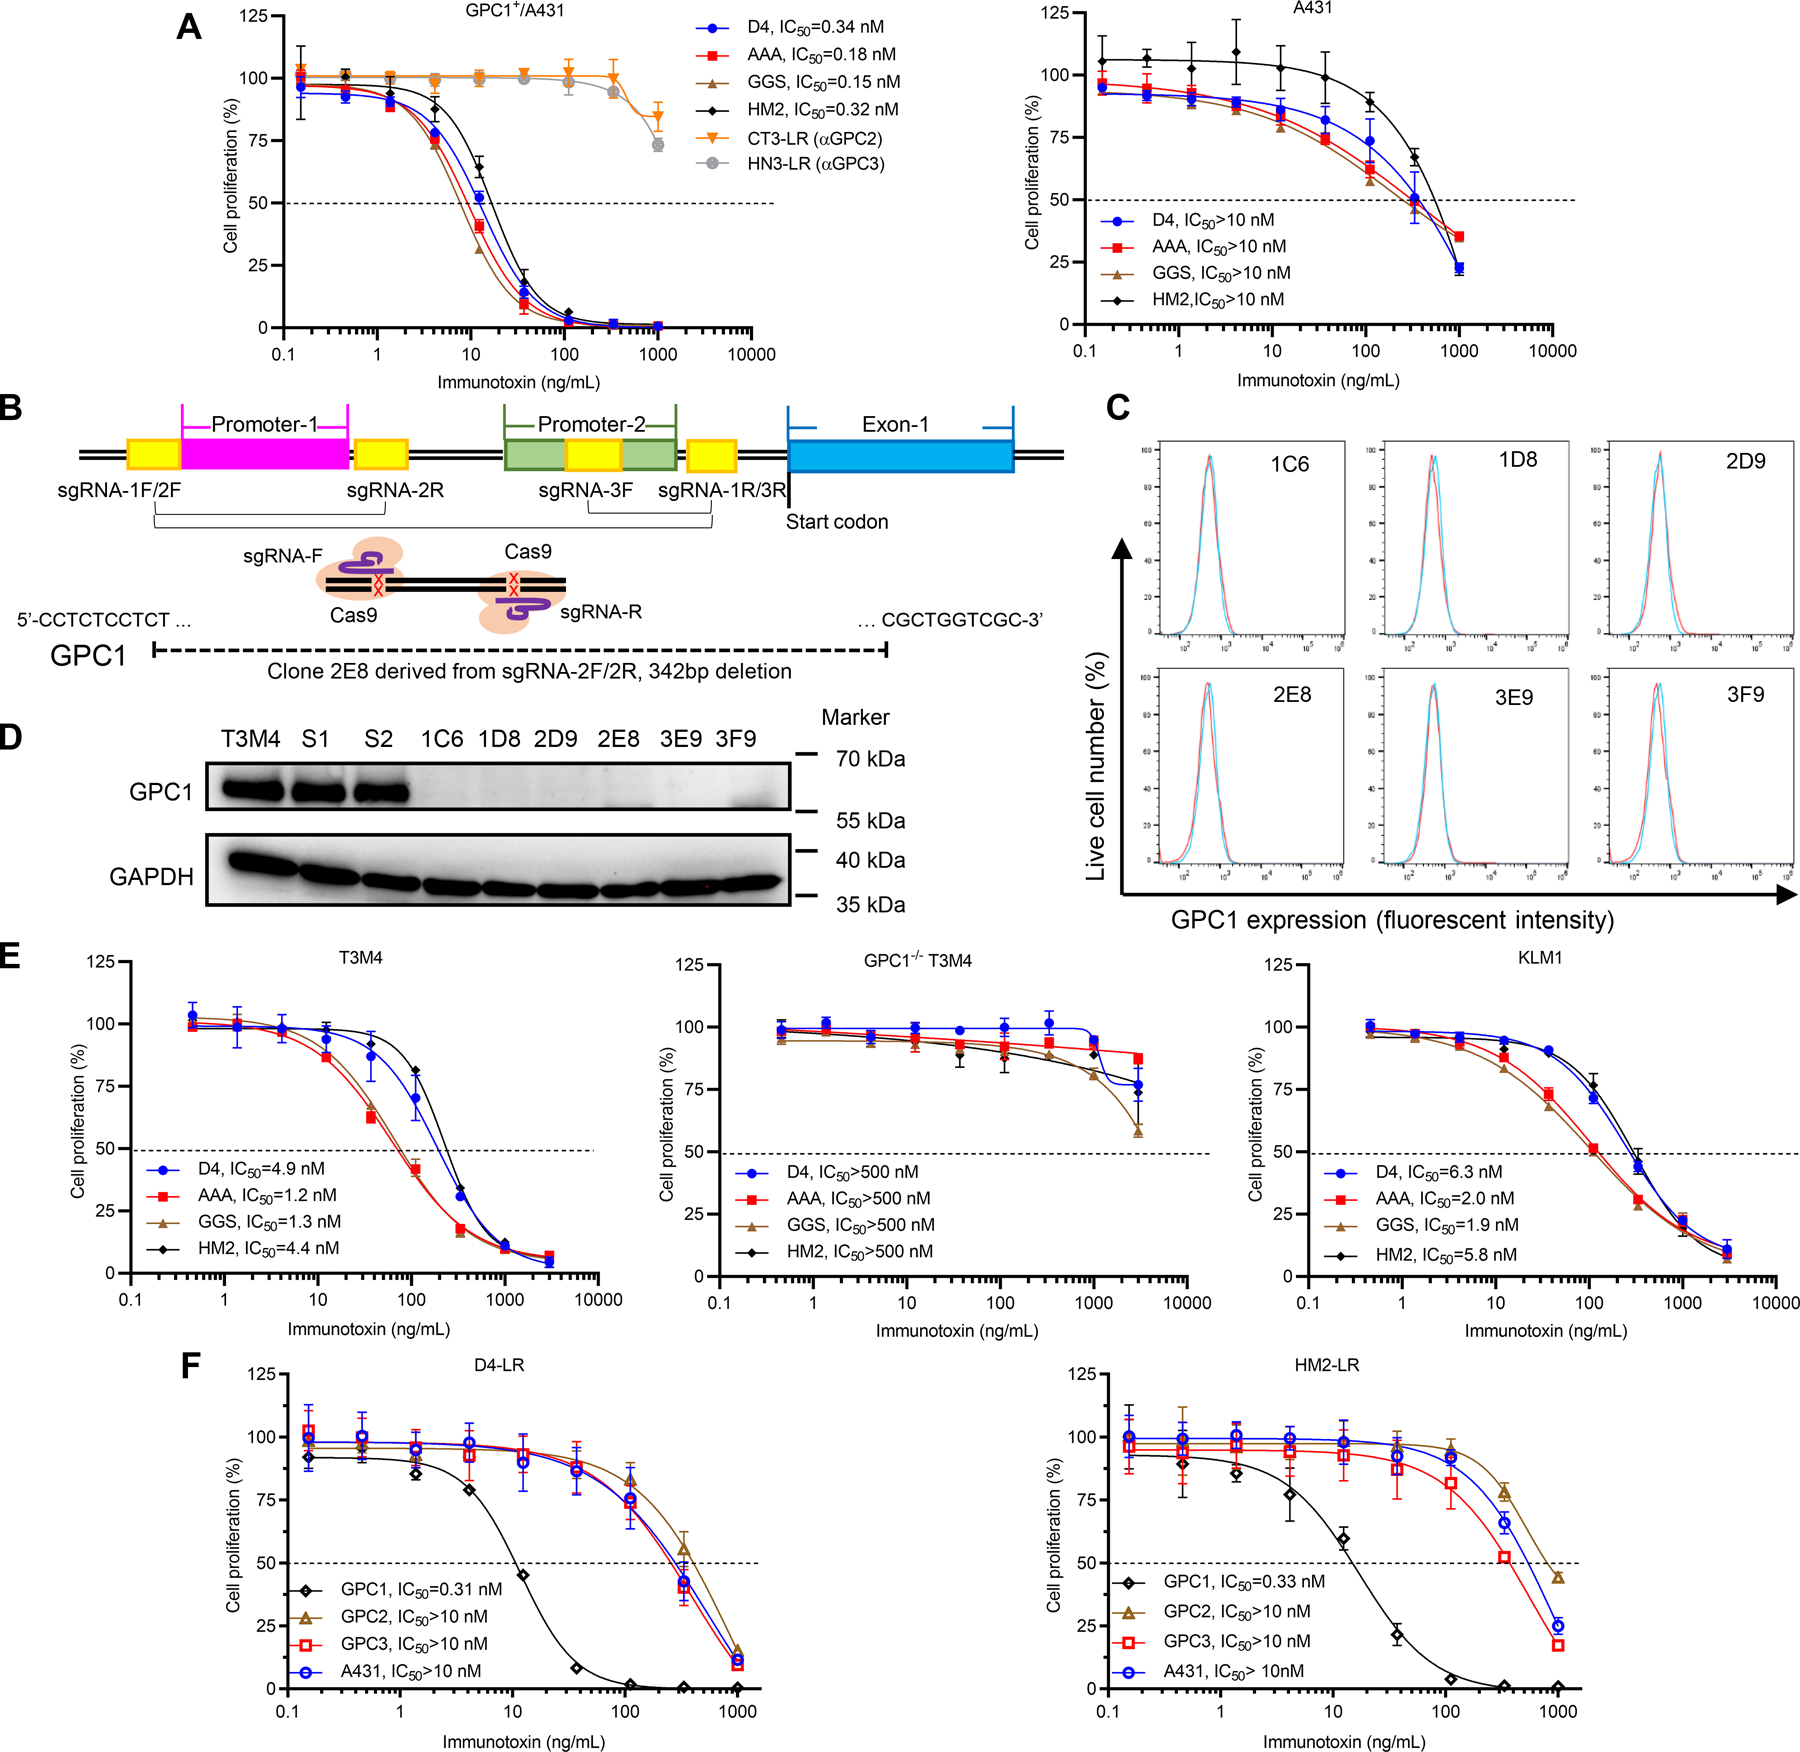
Figure 3. Anti-GPC1 immunotoxins showed antigen-dependent cytotoxicity towards pancreatic tumor cells.

A, Cell proliferation inhibitory activity of immunotoxins on GPC1+/A431 and A431 cells determined by WST-8 reagent after 3-day co-culture. CT3-LR (an anti-GPC2 immunotoxin) and HN3-LR (an anti-GPC3 immunotoxin) were two non-GPC1 targeting controls. Horizontal dashed lines indicate the IC50 value. Data points represent mean ± SD. B, Schematic overview of the construction of GPC1 knockout single-cell clones. Two predicted GPC1 promoter regions are indicated in magenta and green, respectively. GPC1 exon1 is indicated in blue. Three pairs of sgRNAs are indicated in yellow. GPC1 gene deletions with 342 base pairs in clone 2E8 are indicated proportionally. C, GPC1 expression on six single-cell clones detected by flow cytometry. The histograms in red represent cell surface staining of GPC1 with HM2 antibody; the histograms in blue represent cell surface staining of GPC1 with isotype control. D, Levels of GPC1 on six single-cell clones detected by western blot analysis. S1 and S2 represent T3M4 cells transfected with scrambled sgRNA1 and sgRNA2, respectively. E, Cytotoxicity of immunotoxins on T3M4 cells, GPC1 knockout T3M4 cells, and KLM1 cells. Data points represent mean ± SD. F, Cell proliferation inhibition of D4-LR and HM2-LR on A431 cells overexpressing different glypicans (GPC1+/A431, GPC2+/A431, and GPC3+/A431) as well as wild-type A431 cells. Data points represent mean ± SD. Flow cytometry, western blot, and cytotoxicity data are representative of at least three independent experiments.
