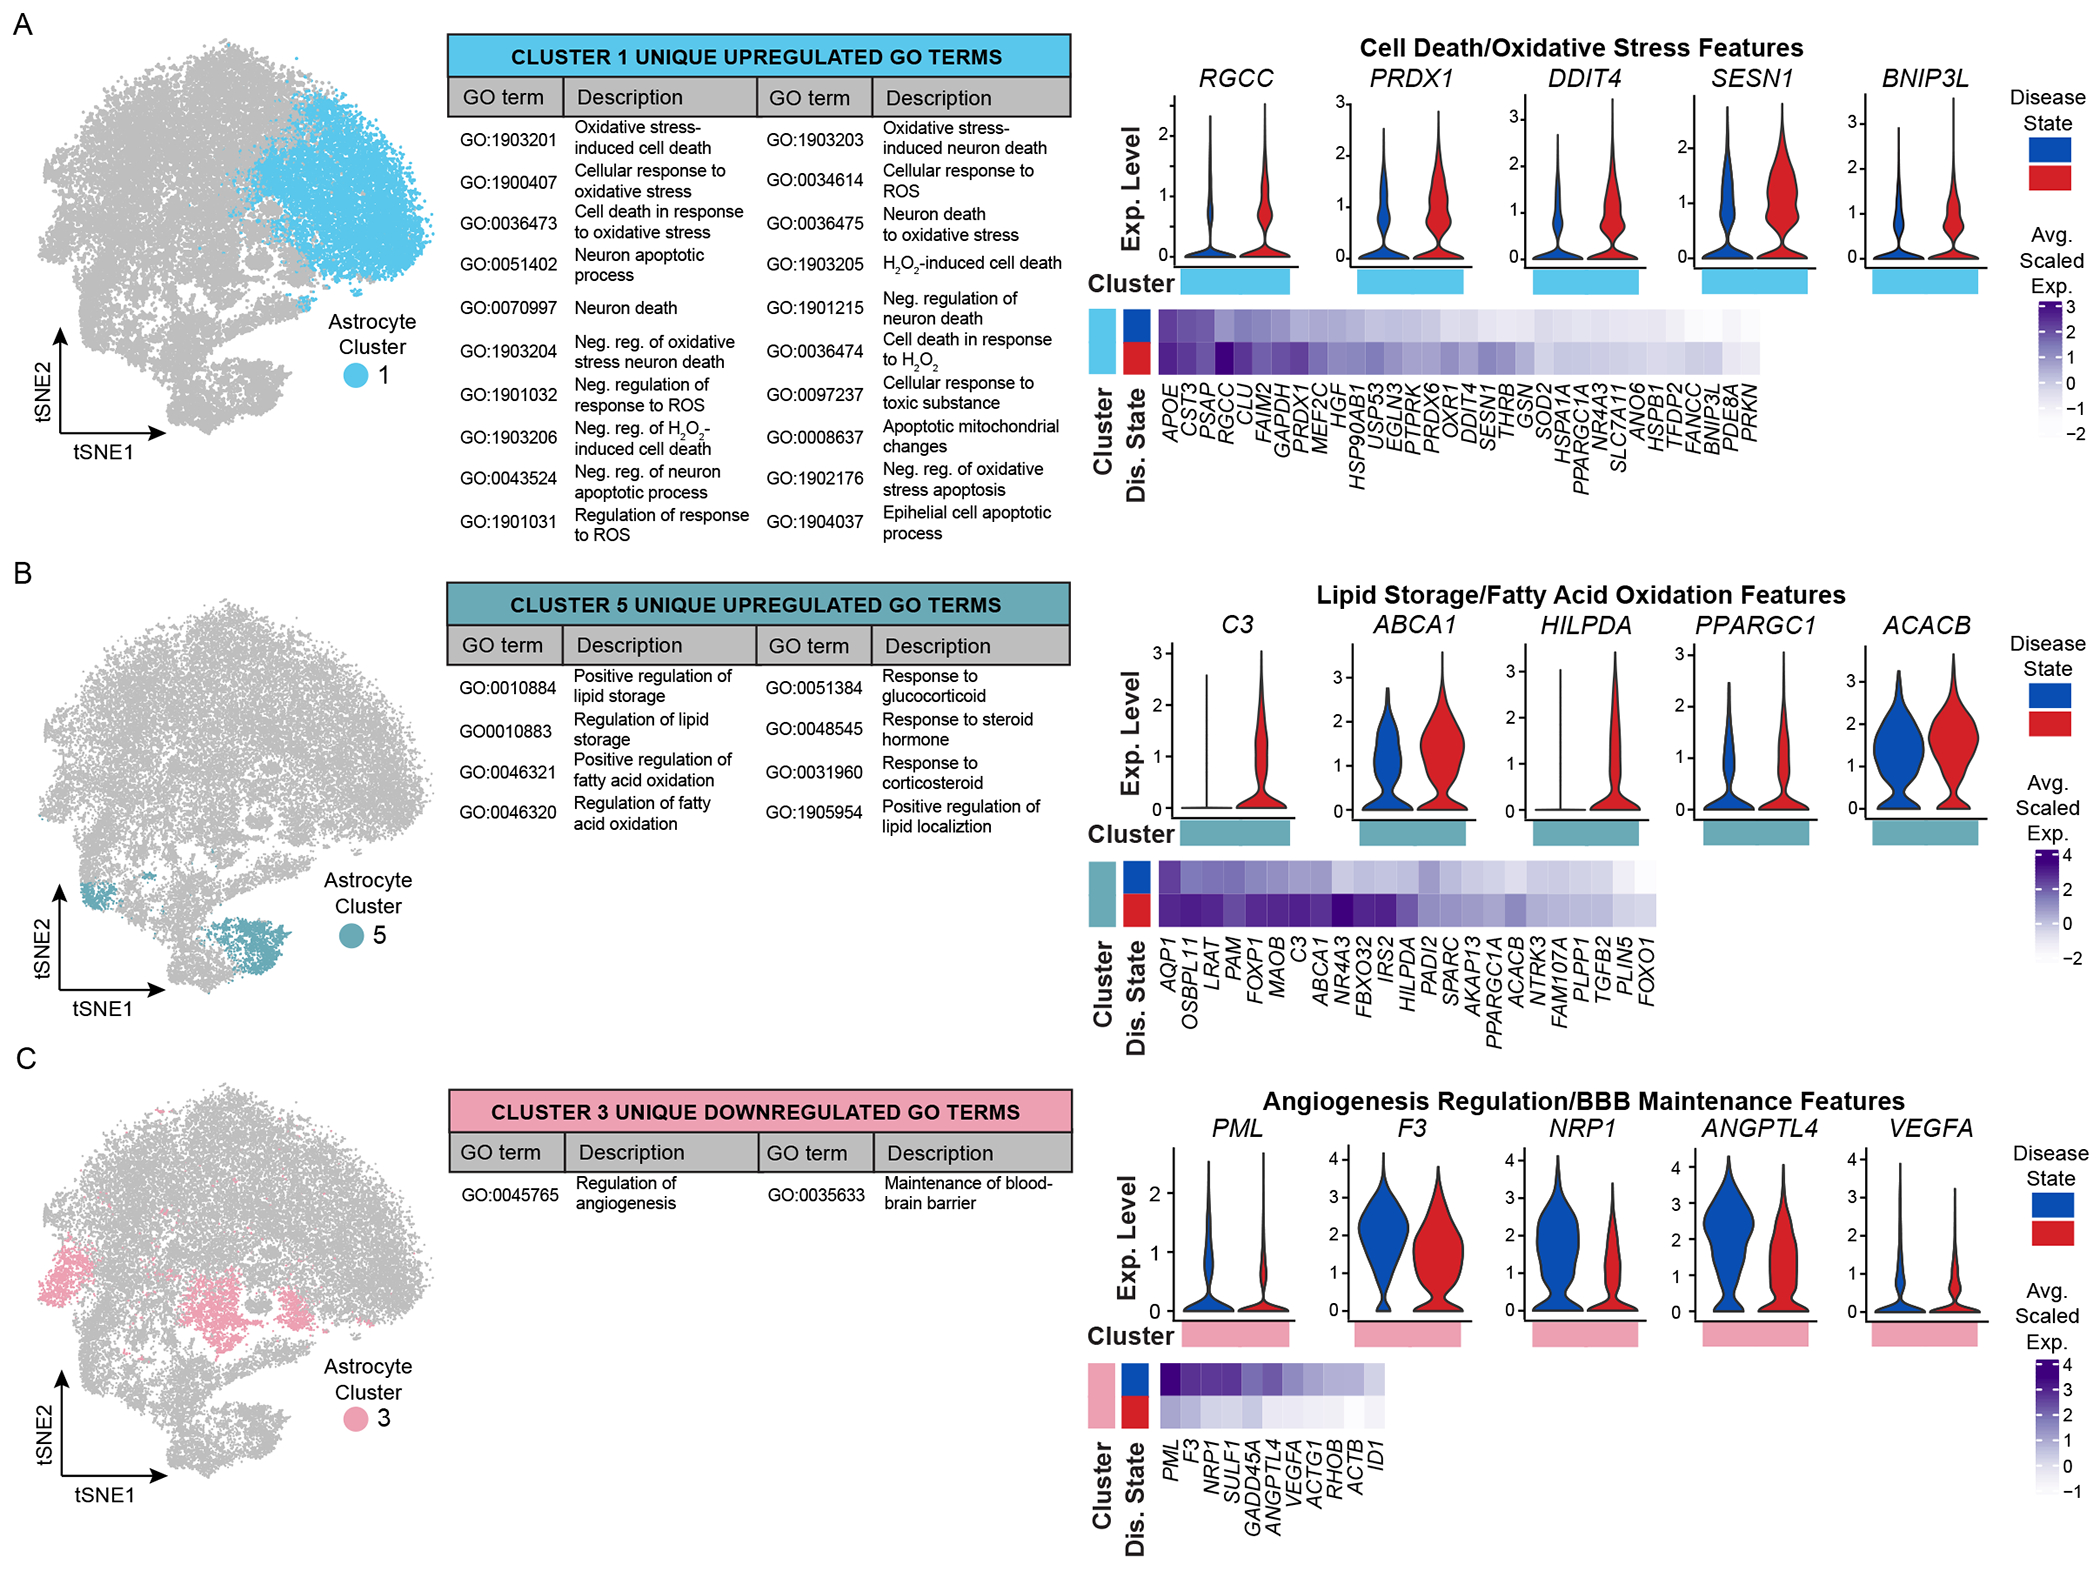
Figure 5. Astrocyte transcriptomic profiles suggest cluster-specific gain and loss of functional changes in Alzheimer’s disease.

tSNE plots highlighting several clusters of interest, unique/shared GO terms, and differentially expressed genes (DEGs) associated with GO terms. GO-associated DEGs are presented as average scaled expression heatmaps by cluster of interest and split by disease state (blue, NS donors; red, AD donors). DEGs are highlighted on violin plots to resolve the range of expression (log normalized UMI counts) across all astrocytes in single or multiple clusters. (A) Upregulated cell death and oxidative stress features unique to cluster 1. (B) Upregulated lipid storage and fatty acid oxidation features unique to cluster 5. (C) Downregulation of angiogenesis regulation and blood brain barrier maintenance features unique to cluster 3. Abbreviations: AD, Alzheimer’s disease; BBB, blood-brain barrier; DEG, differentially expressed genes; Dep., dependent; Dis., disease; GO, gene ontology; H2O2, hydrogen peroxide; Neg., negative; NS, non-symptomatic; Reg., regulation; ROS, reactive oxygen species; UMI, unique molecular identifier. See also Figures S9–S11.
