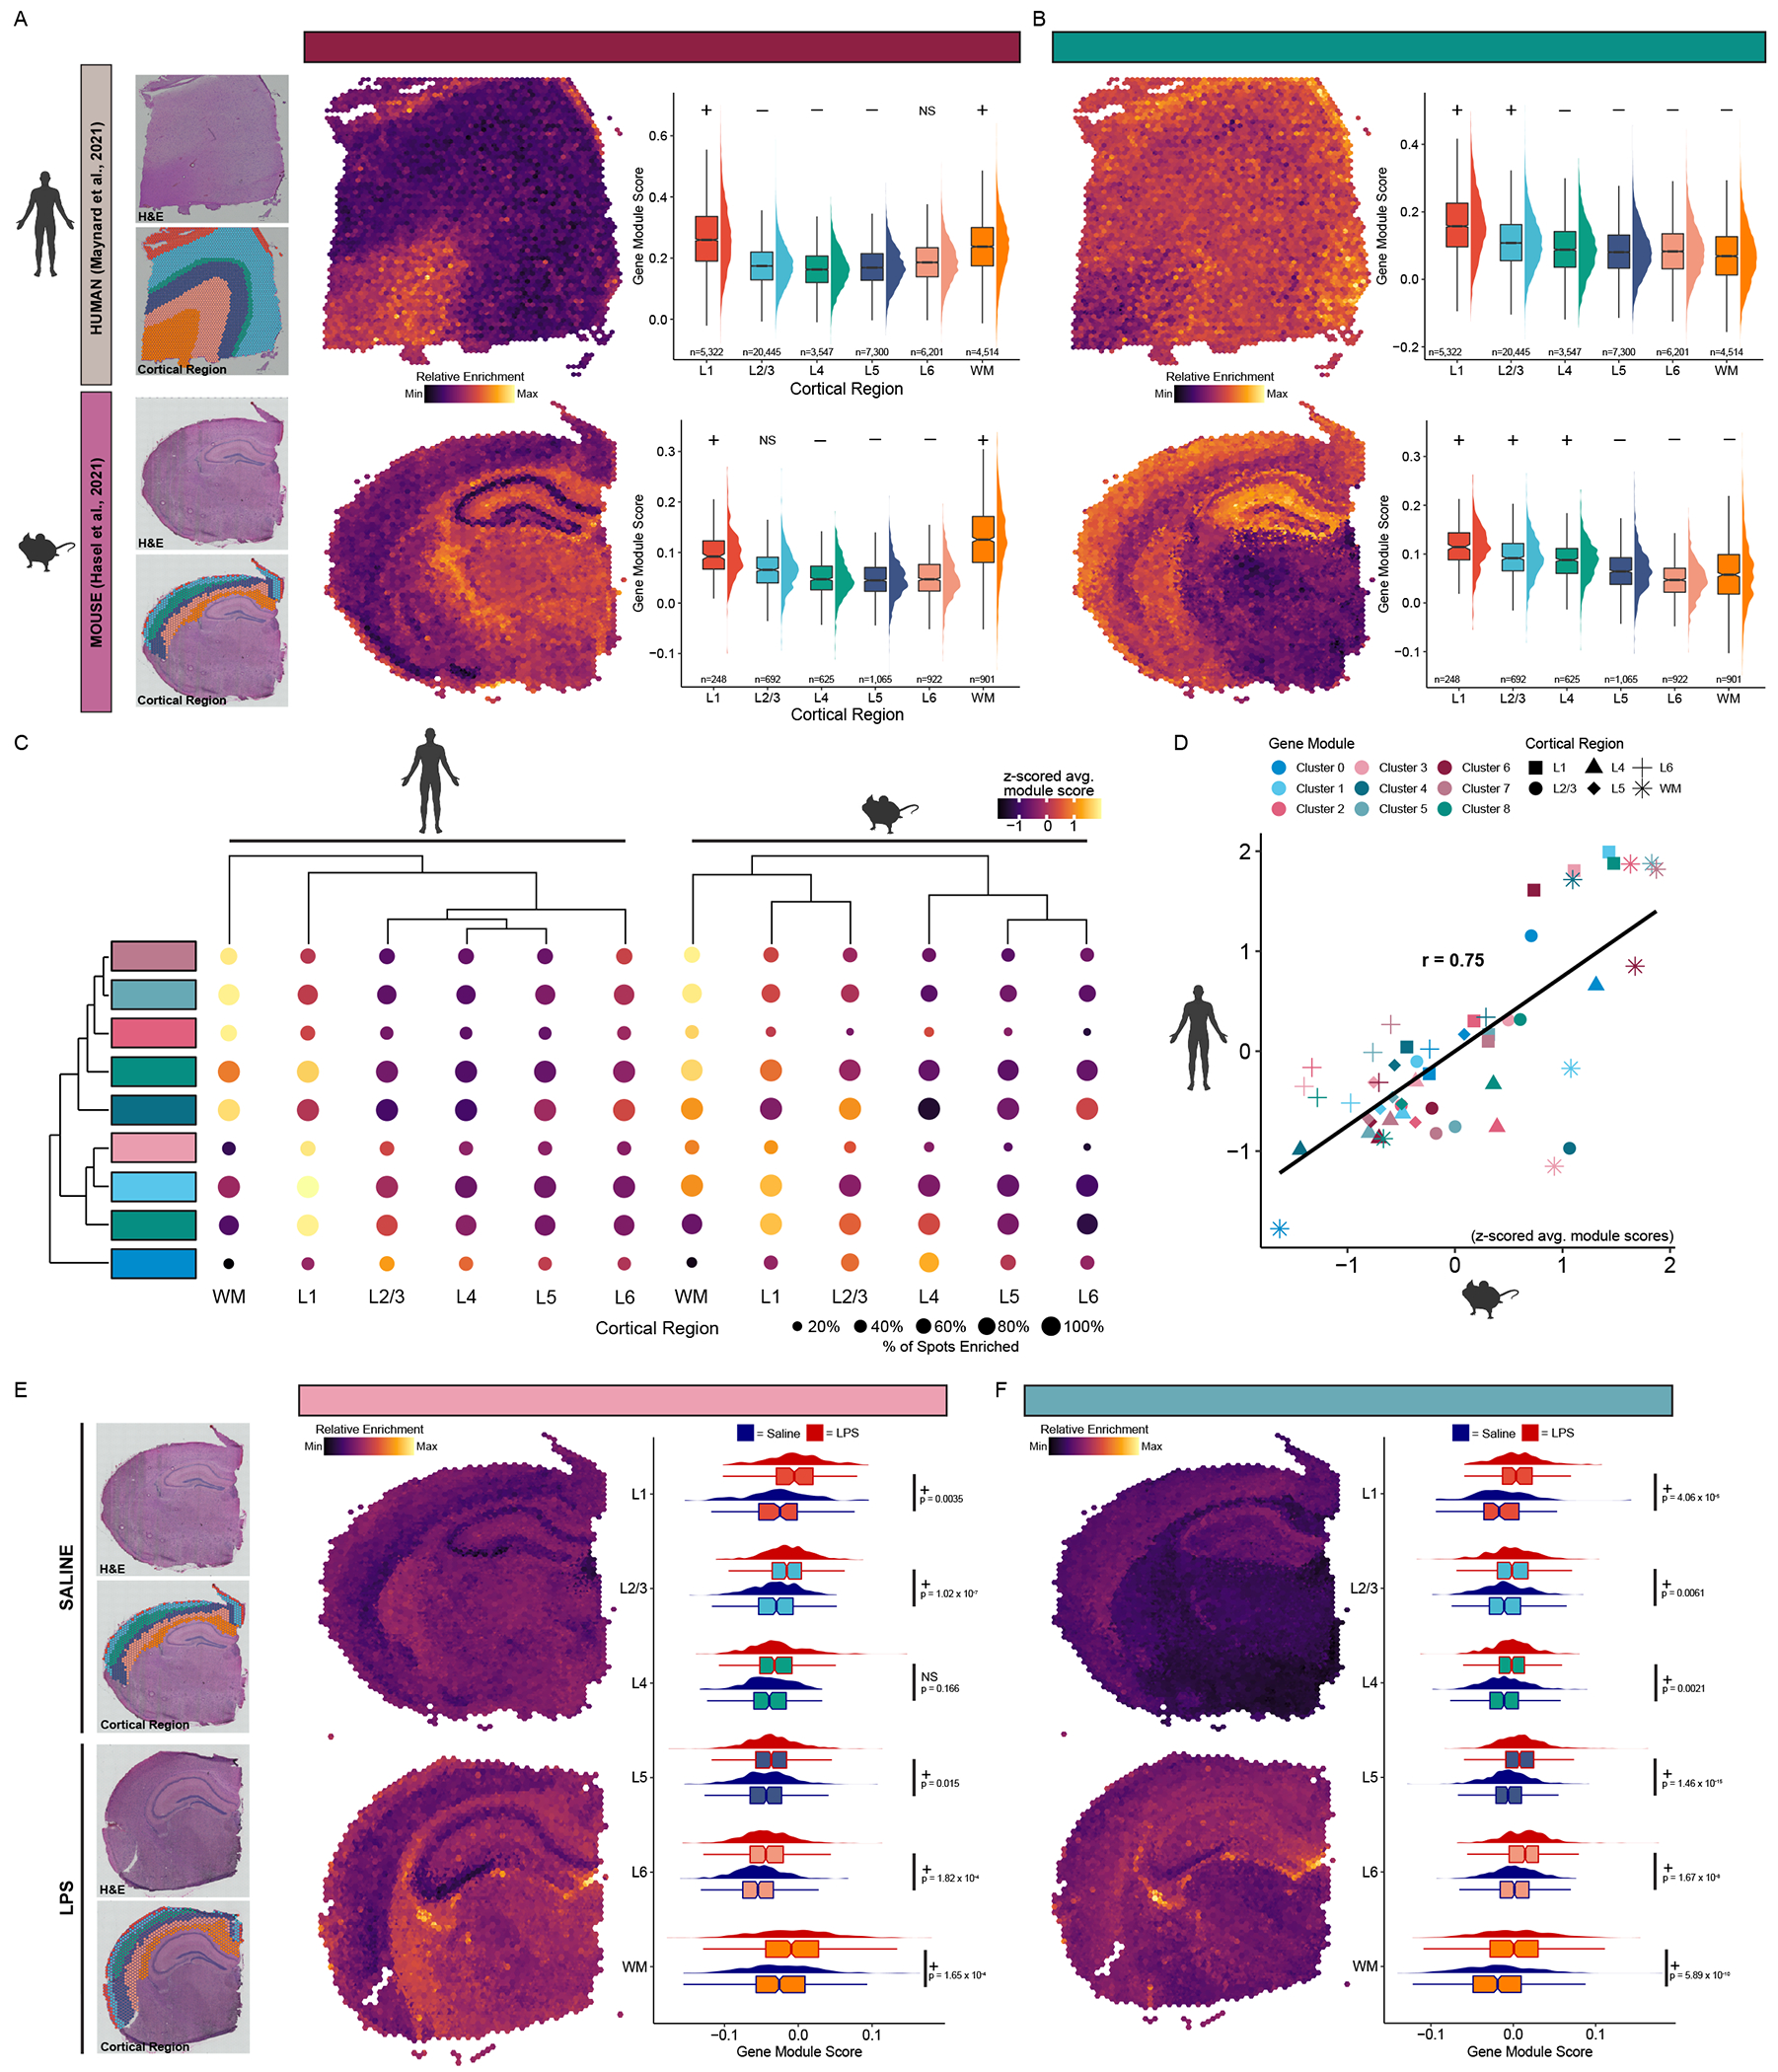
Figure 6. Astrocyte subtypes are regionally heterogeneous.

Visualization and differential enrichment results for Cluster 6 marker genes enriched in Layer 1 and white matter (A), and Cluster 8 genes enriched in the upper layers of the cortex (B). For both: Upper: human spatial transcriptomics data from Maynard et al. (2021). Lower: mouse spatial transcriptomics data from Hasel et al. (2021). (leftmost) H&E staining and regional annotation of spots from the representative Visium section. Relative enrichment of cluster gene module section, and box and density plots of gene module scores across all spots and all sections grouped by cortical region for Clusters 6 and 8. Cluster gene modules were significantly enriched (+) or de-enriched (−) in spots from the indicated region compared to the rest of the cortex (Wilcoxon rank sum test with Bonferroni correction). (C) Summary dot plot of astrocyte cluster gene modules across human (left) and mouse (right) cortical regions. Dots colored by z-scored average gene module score. Dot sizes correspond to the percentage of spots with a gene module score greater than zero, indicating elevated expression of the geneset compared to control genesets (see Methods). (D) Scatter plot comparing z-scored average gene module scores across region and clusters between human and mouse showing cluster module enrichment is similar. A linear regression line is shown (r refers to Pearson’s r correlation coefficient). (E) Relative enrichment of Cluster 3 module overlaid on saline (upper) and LPS (lower) sections. Box & density plot comparing expression of Cluster 3 module across spots in LPS-versus saline-injected mice (right). (F) Relative enrichment of genes upregulated in Cluster 8 in AD overlaid on saline (top) and LPS (bottom) sections. Box & density plot comparing expression of Cluster 8 AD module across cortical regions in LPS-versus saline-injected mice (right). For (E-F): +/− symbol represents whether the Cluster 3 module is significantly upregulated or downregulated in spots from the indicated region in LPS versus saline-injected mice (Wilcoxon rank sum test with Bonferroni correction). See Table S7 for test statistics and p-values. Abbreviations: AD, Alzheimer’s disease; NS, non-significant; H&E, hematoxylin & eosin; LPS, lipopolysaccharide. See also Figure S12.
