
Extended Data Fig. 5. Extended analysis of SPARK depletion.
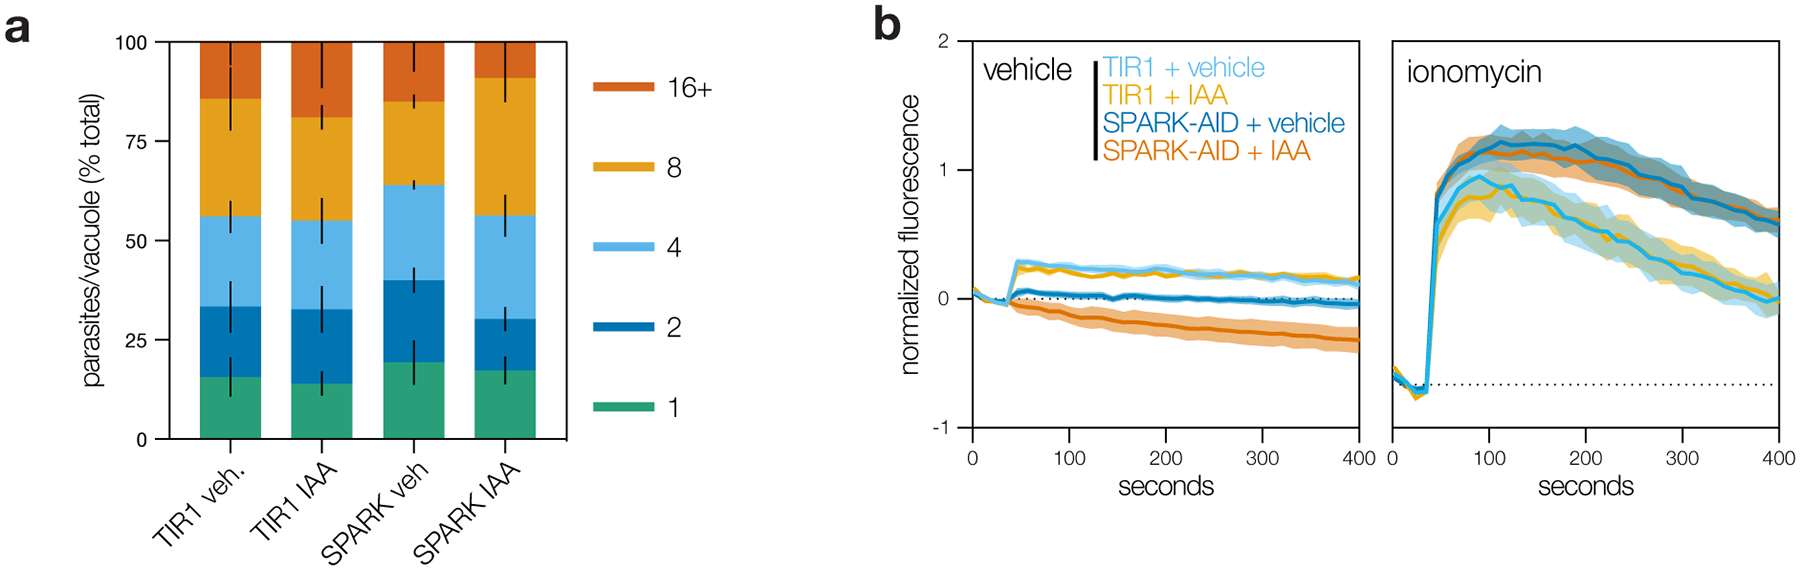
a, Replication assay of SPARK-AID parasites. Parasites were treated with either IAA or vehicle at 3 hours post-invasion and imaged 24 hours later. The number of parasites per vacuole were counted for 100 vacuoles per sample. Mean ± S.E. graphed for n = 3 biological replicates. b, Extracellular parasites in basal Ca2+ buffer stimulated with vehicle or the Ca2+ ionophore ionomycin, following 24 h of treatment with vehicle or IAA. Cytosolic Ca2+ flux was measured in bulk as GCaMP6f fluorescence normalized to the initial and maximum fluorescence following aerolysin permeabilization in 2 mM Ca2+. Mean ± S.E. graphed for n = 3–6 biological replicates.