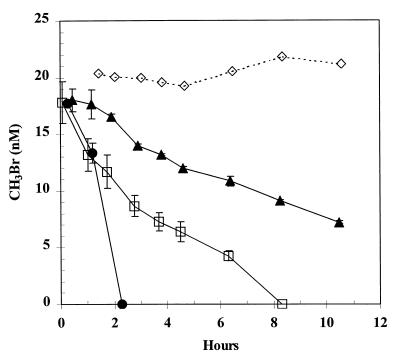
FIG. 3.
Consumption of nanomolar levels of MeBr by glucose-grown cell suspensions of strain IMB-1. Symbols: ●, no additions; □, exposed to chloramphenicol (250 μg/ml) for 2 h; ▴, exposed to chloramphenicol (250 μg/ml) for 21 h; ◊, sterile medium. Cell densities were 1.2 × 10⁹ cells/ml. Symbols represent the mean of three suspensions, and bars indicate ±1 standard deviation. Absence of bars indicates that the error was smaller than the symbols.

