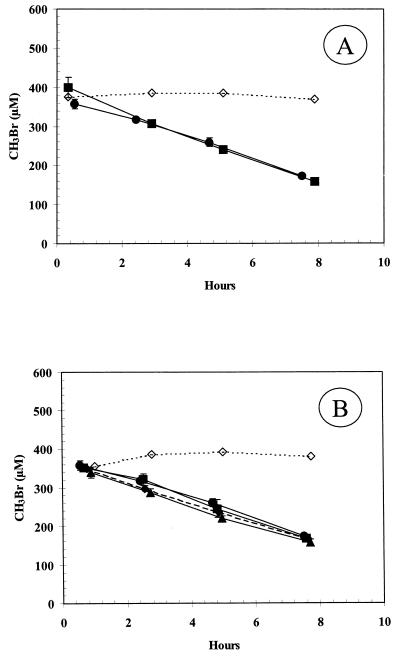
FIG. 5.
Effect of MeF (A) and DFM (B) on the consumption of MeBr by washed suspensions of glucose-grown cells. (A) Symbols: ●, without MeF; ■, 6,000 μM MeF; ◊, sterile medium. (B) Symbols: ●, without DFM; ■, 220 μM DFM; ⧫, 470 μM DFM; ▴, 610 μM DFM; ◊, sterile medium. Cell densities were 3.4 × 10⁸ cells/ml in both experiments. Symbols represent the mean of three suspensions, and bars indicate ±1 standard deviation. Absence of bars indicates that the error was smaller than the symbols.

