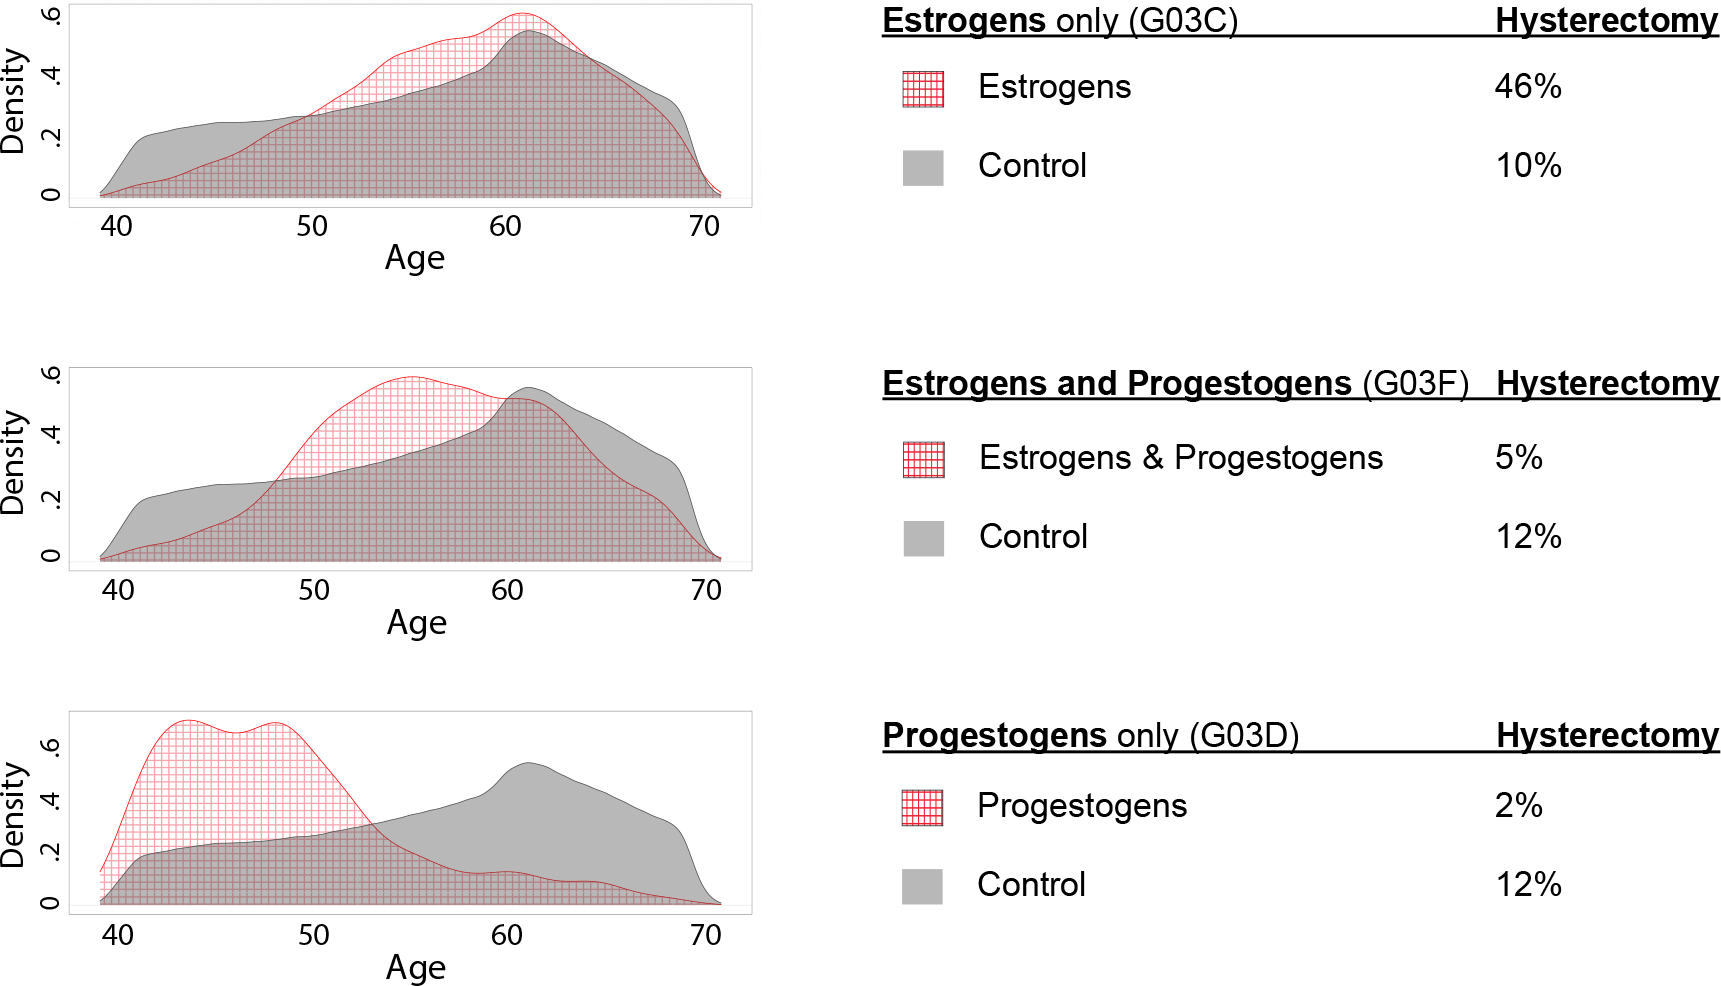
Figure 2. Density plots of age for women taking (and not taking) each of three classes of medications.

G03C=estrogens only, G03F=estrogens and progestogens in combination, and G03D=progestogens only. The red grid pattern depicts ages for women using each medication group and the grey shading depicts controls, meaning women who took none of these medications. Women using contraceptive medications were excluded. Percentages of women who had a hysterectomy are also given for each group. Consistent with indications for prescription, estrogens and estrogens and progestogens in combination were taken by women around the time of menopause, whereas progestogens only tended to be taken by younger women.
