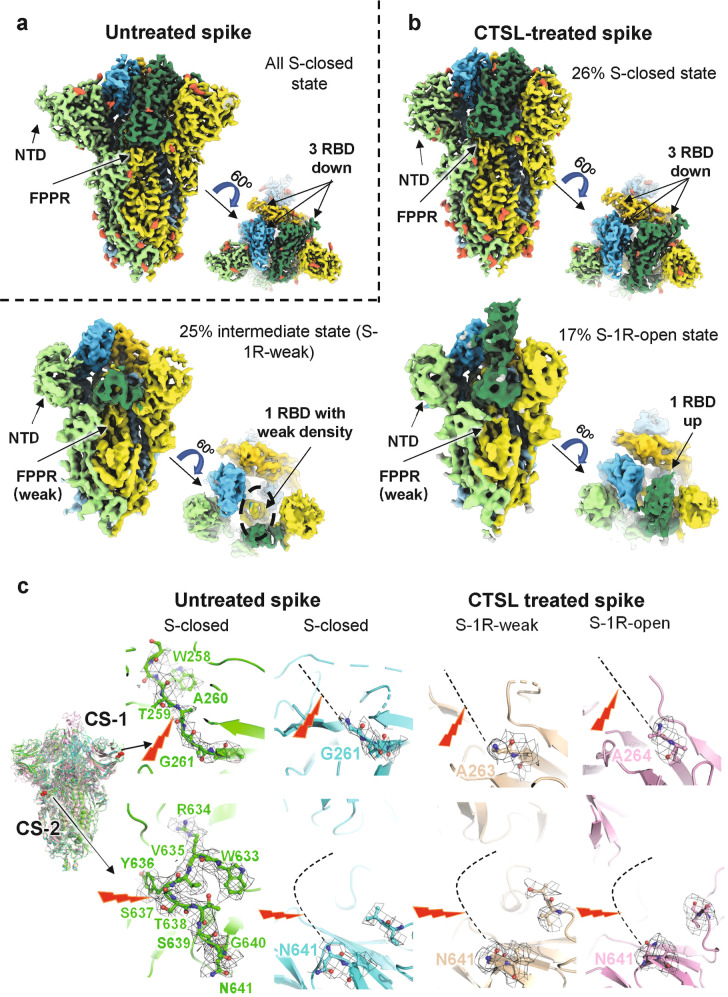
Fig. 2. Cryo-EM structures of CTSL-untreated and -treated SARS-CoV-2 S proteins.
a Side and top views of cryo-EM map of untreated S protein. The three protomers of S protein are shown in light green, yellow, and sky blue. The three RBD domains are highlighted in Sea Green, gold, and deep sky blue, respectively. Glycosylation modifications are colored in tomato. b Side and top views of cryo-EM map of CTSL-treated S protein in different states. The map colors are as same as a. c The four structures of S proteins are superposed together in different colors. CS-1 and CS-2 sites are colored in red and as indicated. The CS-1 and CS-2 regions are zoomed in to show the details. The cleavage sites are indicated by the red lighting-shaped symbol. For untreated S protein, the electron density around the cleavage site is represented as black grid. For the CTSL-treated S, the cleavage site cannot be traced and is represented as dotted line.

