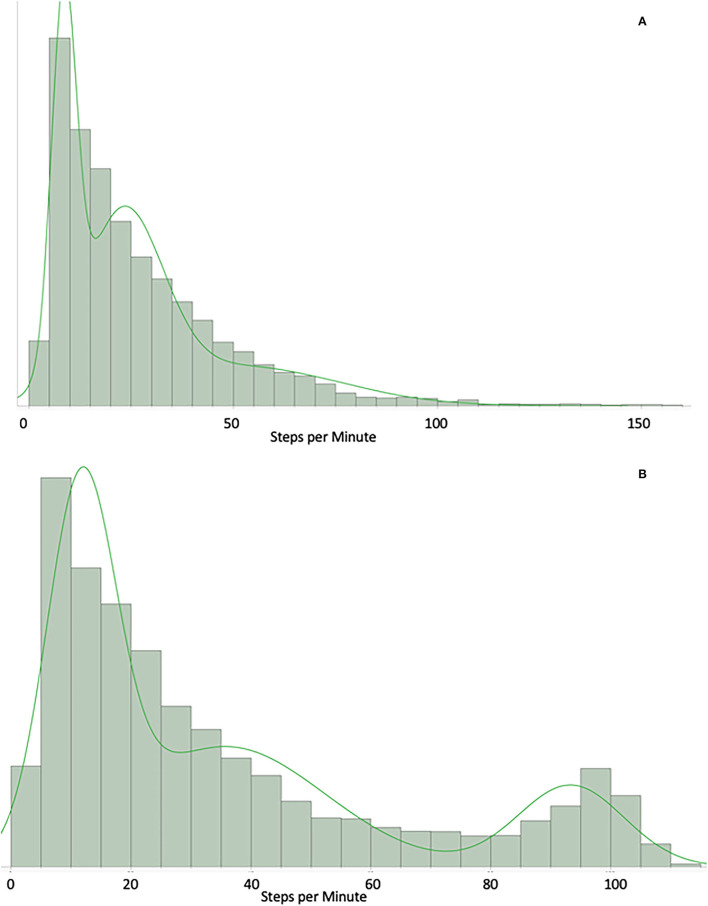
Figure 2.
(A) Example of a participant who spends most of the time in low levels of physical activity. GMM: X axis = count of steps per minute over 1 month. Example of a participant who spend most of their time in low levels of physical activity (10–30 steps/min). (B) Example of a participant who performs some higher physical activity. GMM: X axis = count of steps per minute over 1 month. Example of a participant who do some level of higher physical activity (bump around the 100–130 steps/min).

