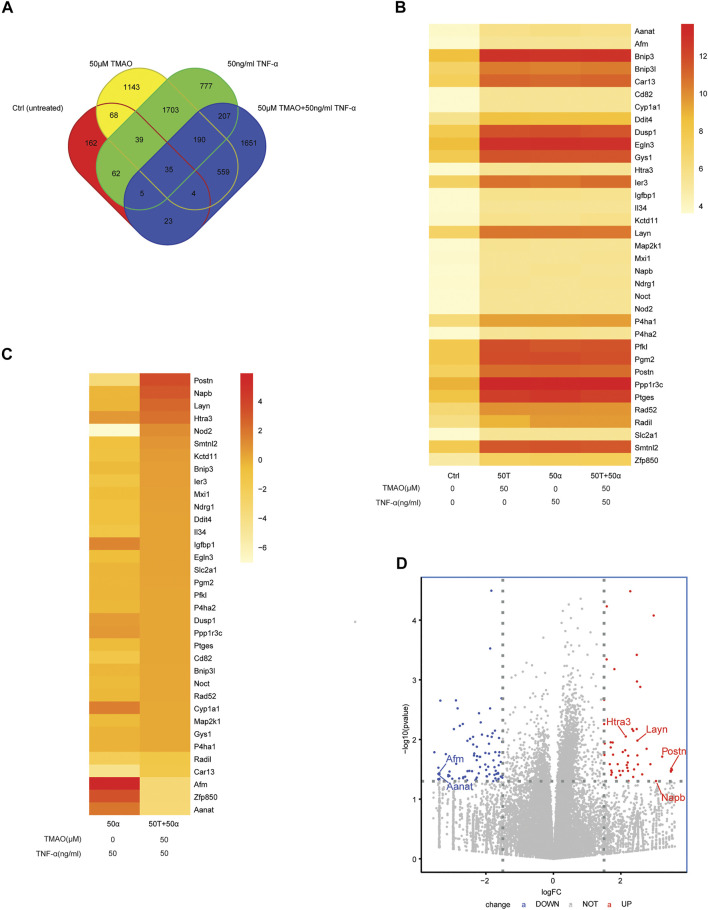
FIGURE 2.
Transcriptomic alterations in TMAO-induced primary liver cancer cells. (A) Venn diagrams showing the crossover between the differentially expressed genes (DEGs) in untreated Hepa1-6 cells (Group Ctrl), and Hepa1-6 cells treated with 50 μM TMAO alone (Group 50T), 50 ng/ml TNF-α alone (Group 50α) or 50 ng/ml TNF-α and 50 μM TMAO in combination (Group 50T + 50α). (B) Heatmap showing the DEGs common to the four treatment groups; FC > 2 and p < 0.05. (C) Heatmap showing the DEGs common to Group 50α and Group 50T + 50α; FC > 2 and p < 0.05. (D) Volcano map showing the significant differentially expressed genes between Group 50α and Group 50T + 50α; FC > 2 and p < 0.05; FC: Fold change.

