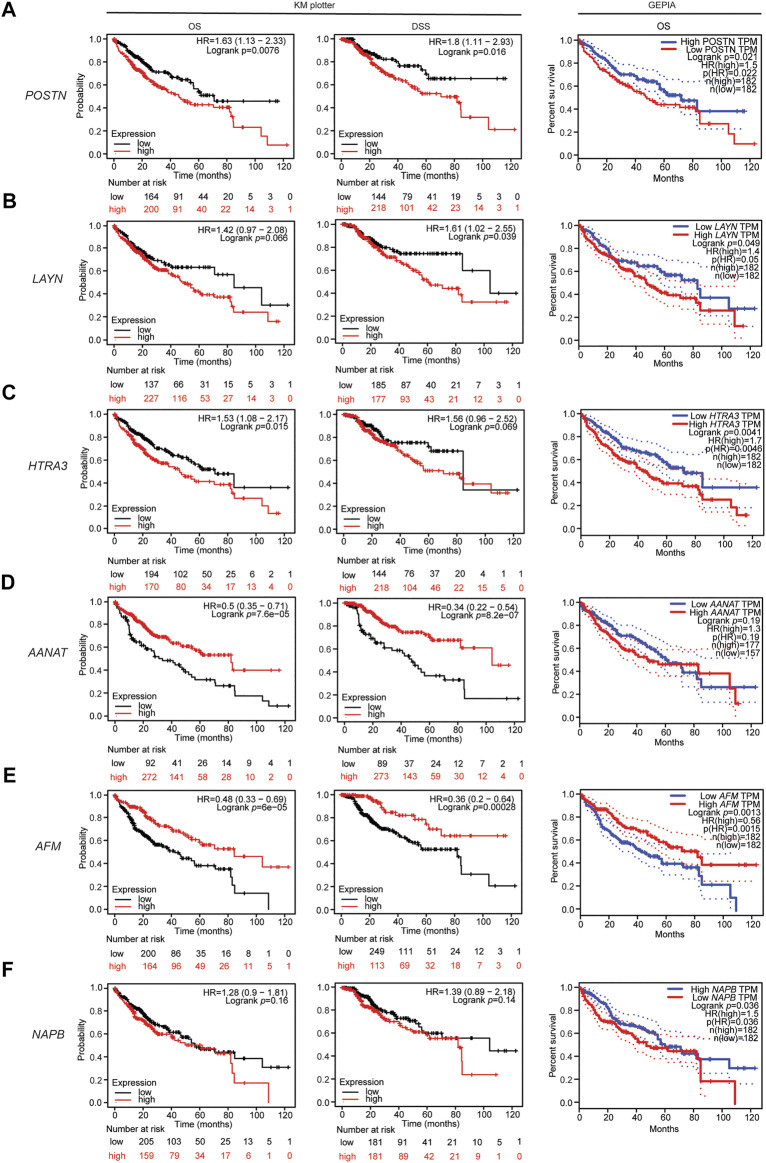
FIGURE 3.
Associations between the DEGs and patient outcomes in liver cancer. Overall survival curve for patients with liver cancer in the GEPIA database (right) and overall survival and disease specific survival curves (left, center) for patients with liver cancer in the Kaplan-Meier plotter databases stratified by expression of (A) POSTN, (B) LAYN, (C) HTRA3, (D) AANAT, (E) AFM, and (F) NAPB.

