
FIGURE 5.
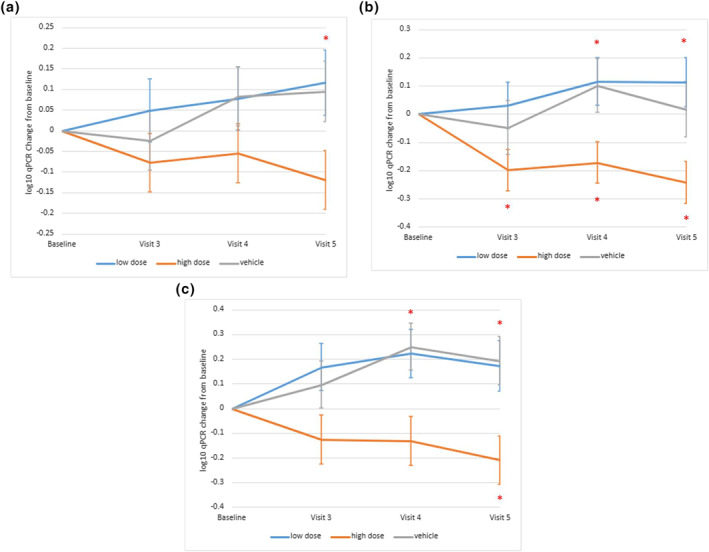
Plots of mean changes from baseline in (a) Cutibacterium spp. qPCR log10 (copies/sample) over time (Per Protocol population), (b) qPCR response by baseline Cutibacterium spp. bacterial burden (Full Analysis set) and (c) qPCR response by baseline sebum (Full Analysis set). Asterisk indicates a statistically significant difference between the BX001 high dose group and vehicle (upper asterisk) or within BX001 high dose group compared to baseline value (lower asterisk). Data represent mean ± SEM (standard error of the mean)