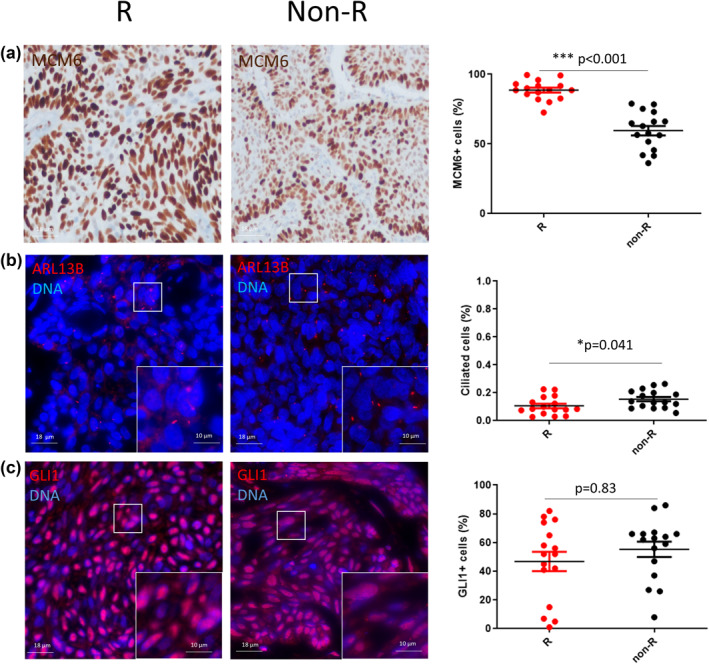
FIGURE 1.

Quantitative assessment of proliferation, Hedgehog pathway activation and cilia in recurrent (R) and non‐recurrent (non‐R) basal cell carcinoma. (a) Representative micrographs showing MCM6+ cells (MCM6, brown; nuclei are counterstained with haematoxylin) and dot plot with mean and SD. (b) Magnification corresponding to the selected area is shown Representative micrographs showing ciliated cells (ARL13B, red; nuclei are stained in blue with DAPI). Magnification corresponding to the selected area is shown. *p < 0.05 and ***p < 0.001; non‐R versus R. (c) Representative micrographs showing GLI1+ cells (GLI1, red; nuclei are stained in blue with DAPI) and dot plot with mean and SD
