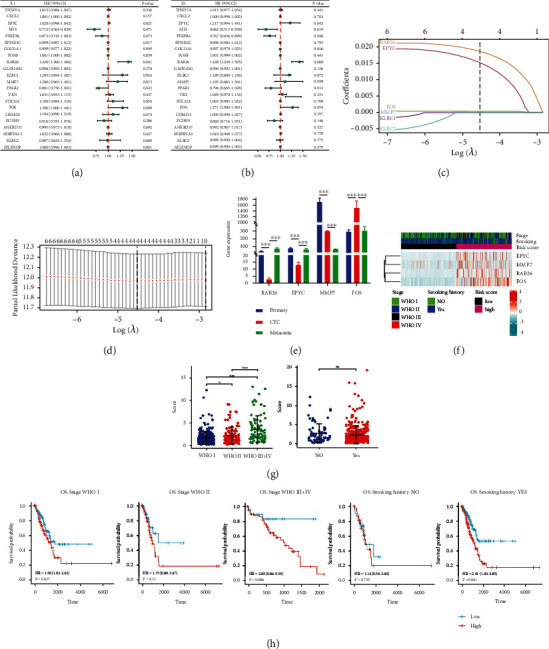
Figure 3.

Establishment of the CTCR model in TCGA-LUAD cohort (n = 447). (A, B) Univariate and multivariate Cox regression analyses were used to examine the correlation between DEGs and OS. (C) LASSO coefficient profiles of 6 DEGs. (D) Cross-validation revealed an optimum parameter of 4 in the LASSO model. (E) The relative expression of 4 risk genes in the primary tumour, CTCs and metastasis. (F) Unsupervised clustering of the 4 candidate genes using the tumour stage, smoking history and risk score as patient annotations. (G) Dot chart reflecting the risk scores of samples grouped based on the clinical stage and smoking history (H) Prognostic value in the high- and low-risk groups of different clinical subgroups (tumour stages and smoking history). The asterisks represent the statistical p-value (∗p < 0.05; ∗∗p < 0.01; ∗∗∗p < 0.001).
