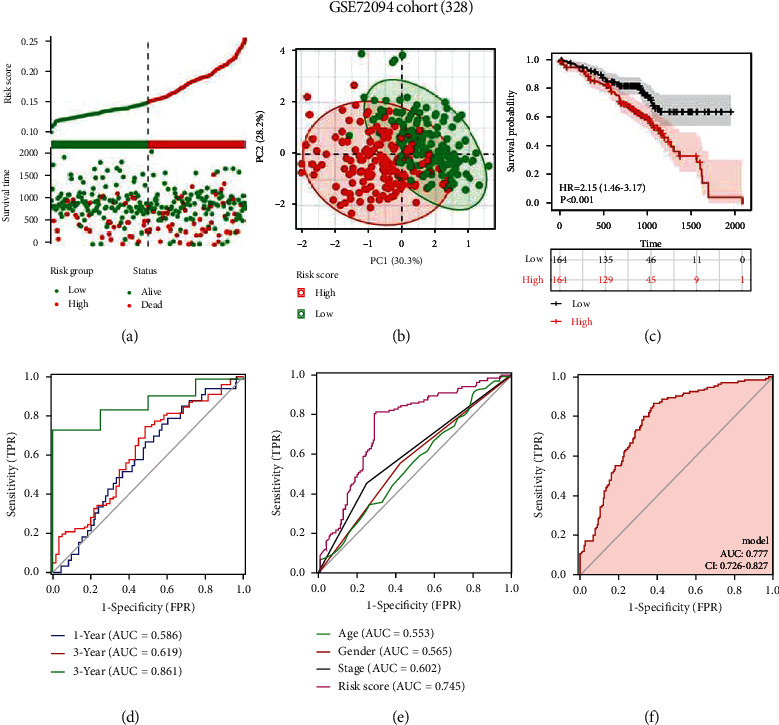
Figure 5.

Validation of the CTCR model in the GSE72094 dataset (n = 328). (a) Survival status and risk scores in the validation cohort. (b) PCA analysis of grouped samples in the validation cohort. (c) KM curves demonstrating longer OS in the low-risk group. (d) AUC values of time-dependent ROC curves verify the predictive accuracy of the risk score. (e) Comparison of ROC curves among patients with different clinical characteristics, such as age, sex and stage, and risk scores in the validation cohort. (f) ROC curve based on risk scores and other prognostic factors.
