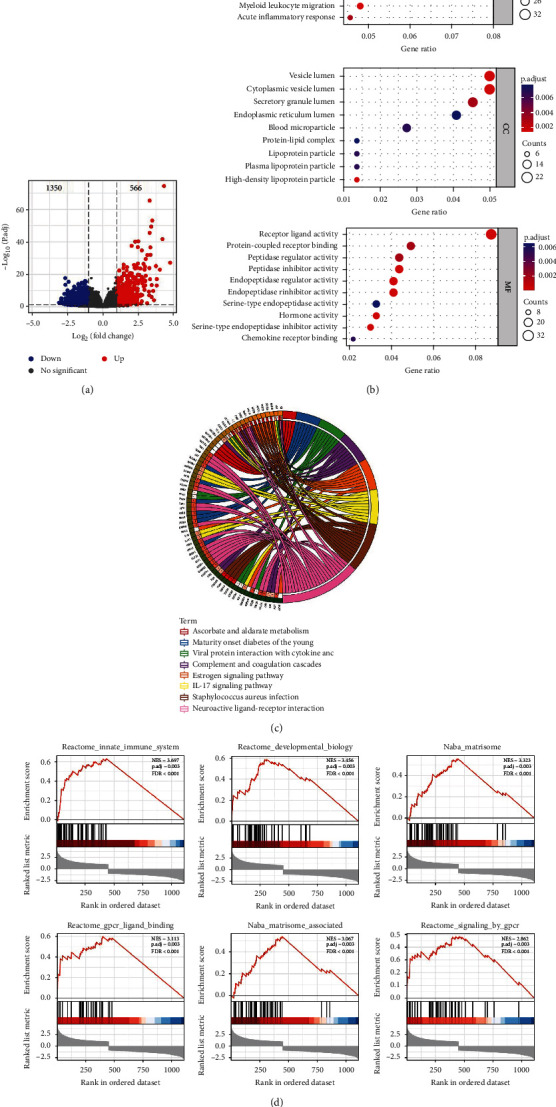
Figure 6.

Enrichment analysis of DEGs in TCGA-LUAD cohort (n = 447). (a) Volcano plot depicting DEGs in the high- and low-risk groups in the training cohort (including 566 upregulated and 1350 downregulated genes). (b) GO analysis was used to determine critical biological processes, cellular components and molecular functions, indicating that the DEGs were significantly enriched in immune-related processes. (c) Chord diagram demonstrating the results of KEGG analysis, indicating that the DEGs were considerably enriched in immune-related signalling pathways. (d) GSEA of the high- and low-risk groups based on the CTCR model.
