Figure 7.

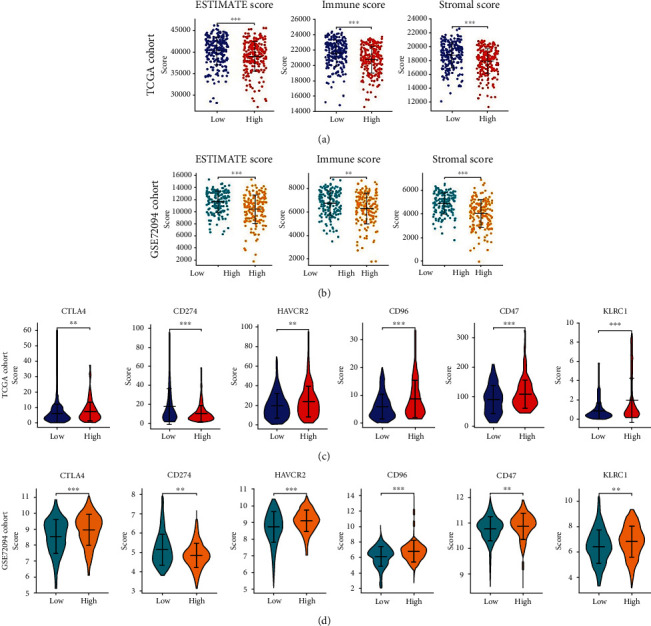
Immune cell infiltration landscape of LUAD. (A, B) ESTIMATE, immune and stromal scores of high- and low-risk patients in TCGA (a) (n = 447) and GSE72094 (b) (n = 328) datasets. (C, D) The expression levels of immune checkpoint molecules in the high- and low-risk groups in TCGA (c) and GSE72094 (d) datasets. The asterisks represent the statistical p-value (∗p < 0.05; ∗∗p < 0.01; ∗∗∗p < 0.001).
