
Figure 8.
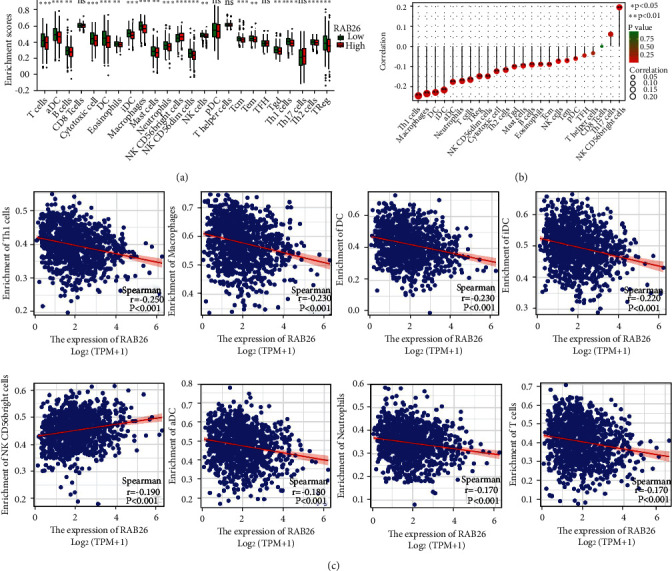
Correlation between RAB26 expression and immune cells in TCGA-LUAD cohort (n = 447). (a) Box plot demonstrating the infiltration levels of immune cells in the high-RAB26-expression versus the low-RAB26-expression group. (b) Lollipop chart demonstrating the correlation between RAB26 and 24 immune cell types. (c) Correlation scatter plot of 8 cells with the largest correlation coefficient with RAB26. The asterisks represent the statistical p-value (∗p < 0.05; ∗∗p < 0.01; ∗∗∗p < 0.001).