
Figure 3.
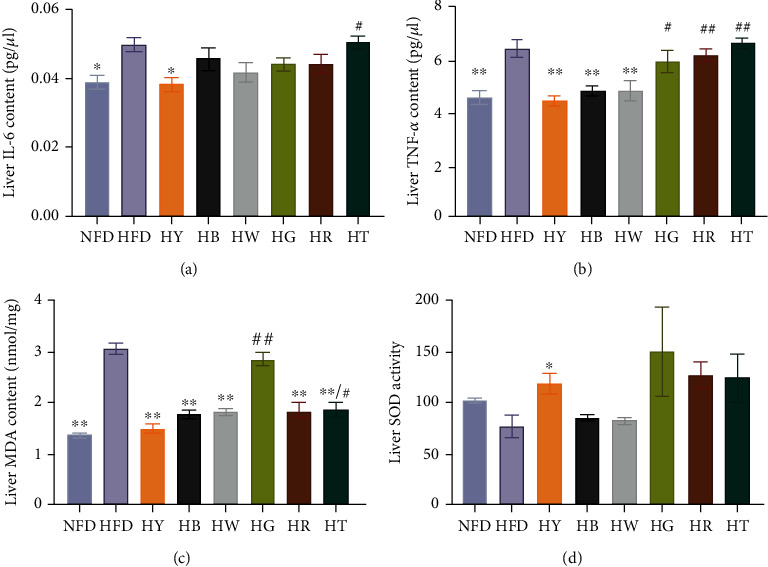
Tea treatments alleviate major liver inflammatory cytokines and redox state in liver: (a) liver IL-6; (b) liver TNF-alpha content; (c) liver MDA content; (d) liver SOD activity. Data were expressed as mean ± SEM. (a–c) Analysis of variance (ANOVA) and Tukey multiple comparison (n = 7). Differences of data (d) were assessed by Kruskal-Wallis test with Dunn's multiple comparison test, respectively (n = 7). ∗p < 0.05, ∗∗p < 0.01 compared with the HFD group. #p < 0.05, ##p < 0.01 compared with the NFD group.