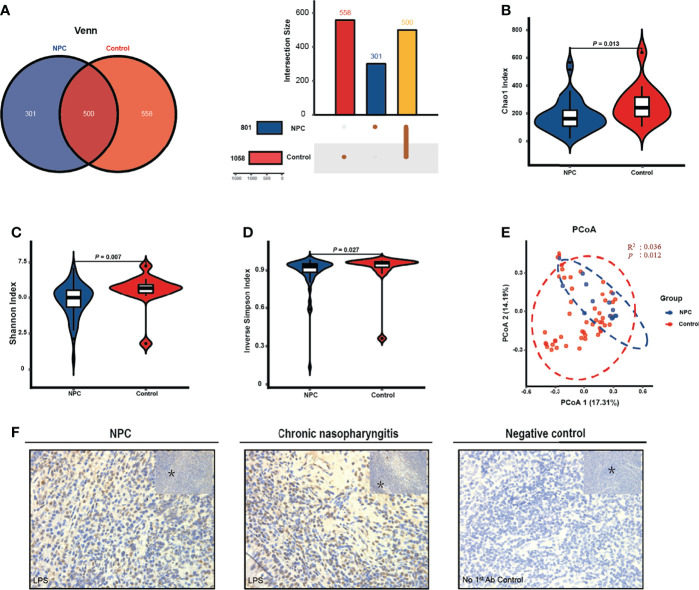
Figure 1.
The intratissue microbiome diversity between the nasopharyngeal carcinoma (NPC) group and the control group. (A) Venn and UpSet diagrams illustrate shared ASVs in both the NPC and control groups. The alpha diversity in the NPC group and the control group is estimated by Chao1 index (B), Shannon index (C), and inverse Simpson index (D). (E) Beta diversity is measured by principal coordinate analysis (PCoA) based on Bray-Curtis distance metrics. (F) Representative cores depict the staining of bacterial LPS patterns in NPC and chronic nasopharyngitis. The asterisks indicate the region selected for higher magnification at 40X.

