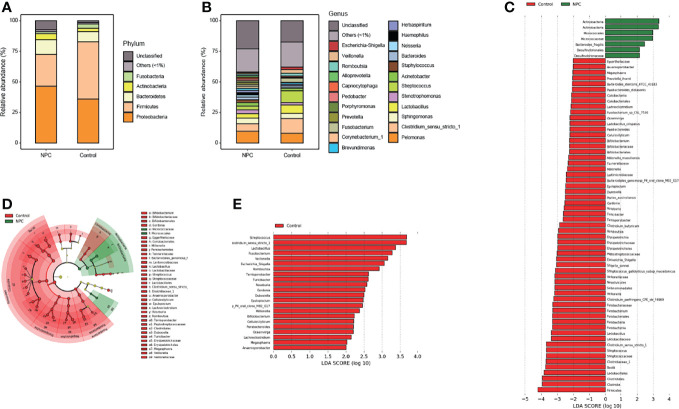
Figure 2.
Distinct microbiome composition between the NPC group and the control group. Taxonomic composition in the NPC group and the control group exhibits average relative abundance at the phylum (A) and genus (B) levels. (C) Differential taxa from phylum to species were identified by LEfSe with a meeting LDA significant value (LDA > 2, red color indicating taxa abundant in the control group; green in the NPC group). (D) Cladogram shows the differential taxa at all levels from phylum to species. (E) Differential taxa at the genus level are represented (LDA > 2, red color indicating taxa enriched in the control group; green in the NPC group).

