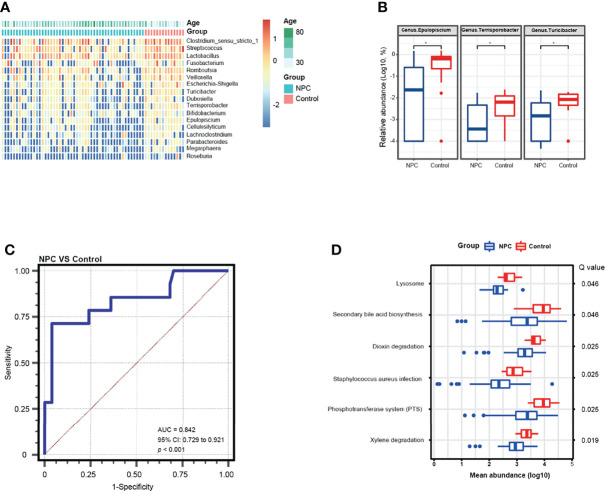
Figure 3.
Differential genera and metabolic function pathways associated with NPC and chronic nasopharyngitis. (A) A heatmap shows the relative abundance of significant genera between the NPC group and the control group (Mann–Whitney tests, unadjusted p value < 0.05). (B) Differential genera in relative abundance detected by a MaAsLin model with adjustment for age are exhibited (* means corrected Q value < 0.25). (C) ROC curve analysis of differential genera for diagnosis of NPC from chronic nasopharyngitis. (D) Distinct metabolic pathways compared between NPC and chronic nasopharyngitis based on KEGG with FDR corrected p value (Q value < 0.05).

