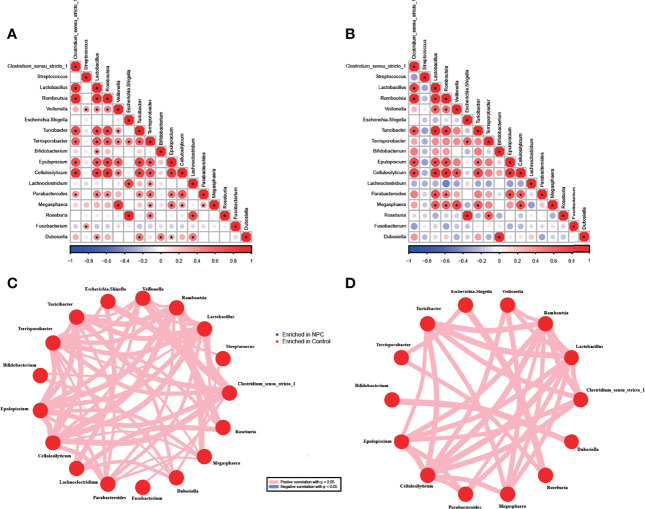
Figure 4.
Correlations between genera in the NPC group and the control group. Correlation among 17 significant genera with unadjusted p value < 0.05 in the NPC group (A) and the control group (B) (*correlation p value < 0.05, red color indicating taxa enriched in the control group; blue in the NPC group). Distinct patterns of significant genera in the NPC group (C) and the control group (D) are plotted by network plot based on statistically significant correlations (correlation p value < 0.05).

