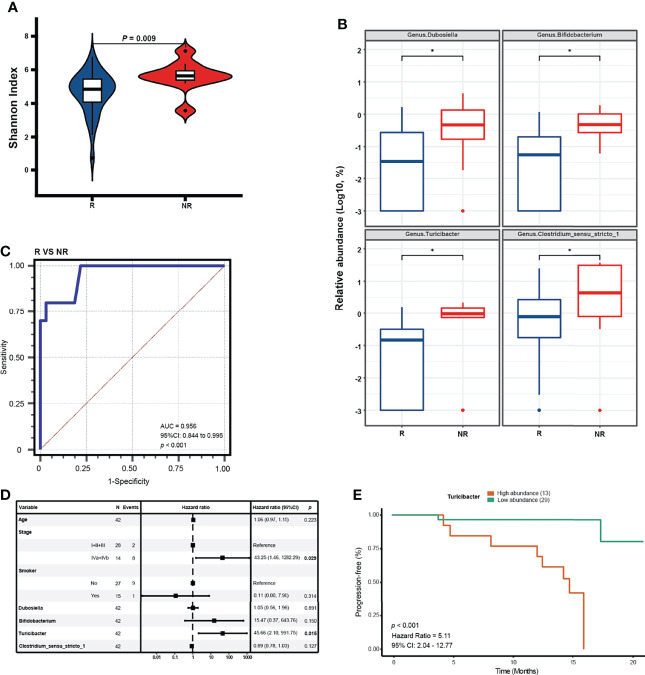
Figure 5.
Differential genera serving as prognostic factors for NPC. (A) The alpha diversity in the NR and R groups is estimated by Shannon index. (B) Significant genera in relative abundance detected by a MaAsLin model with adjustment for age * means (corrected Q value < 0.25). (C) ROC curve analysis of differential genera for diagnosis of R from NR for NPC treatments. (D) Forest plot reveals the selected covariates on clinical characteristics and significant genera tested by multivariate COX regression analysis. (E) Kaplan-Meier (K-M) plot of the PFS by Log-rank test in patients with high relative abundance and low relative abundance of Turicibacter (cutoff: 0.0046).

