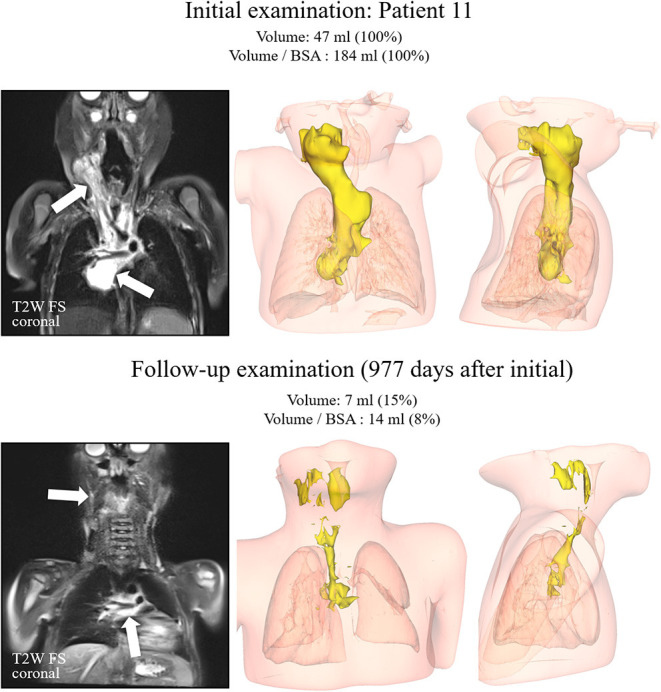
Figure 2.

Patient #11. T2-weighted images with fat saturation in the coronal plane on the left side for both examinations. The kaposiform hemangioendothelioma demonstrated a high signal intensity (arrows) on both examinations, with substantial volume reduction over time. Corresponding 3D reconstructions in anteroposterior and mediolateral views are displayed in the middle and right columns.
