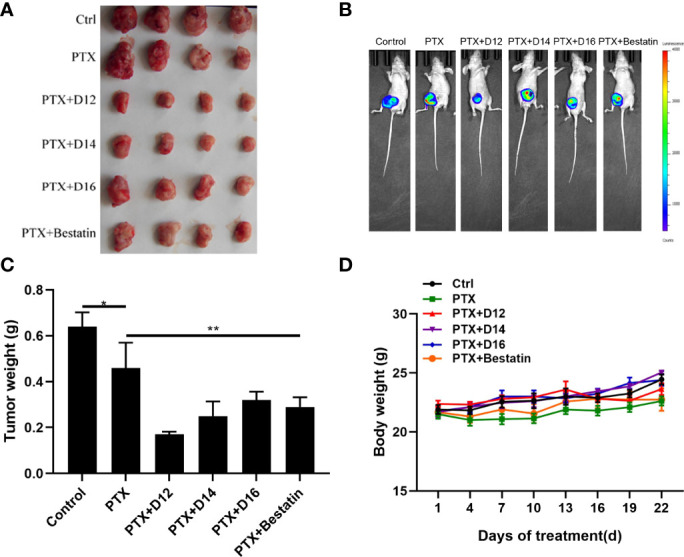
Figure 5.

In vivo anticancer effects of the PTX-APN inhibitor combinations. (A) Dissected tumor tissues taken from mice after administration of various drug combinations; (B) representative in vivo imaging of tumors; (C) Tumor weight plot of different administration groups; (D) mice body weight plot of different administration groups; Data were taken as mean ± SEM (n = 4), *P ≤ 0.05, **P ≤ 0.01.
