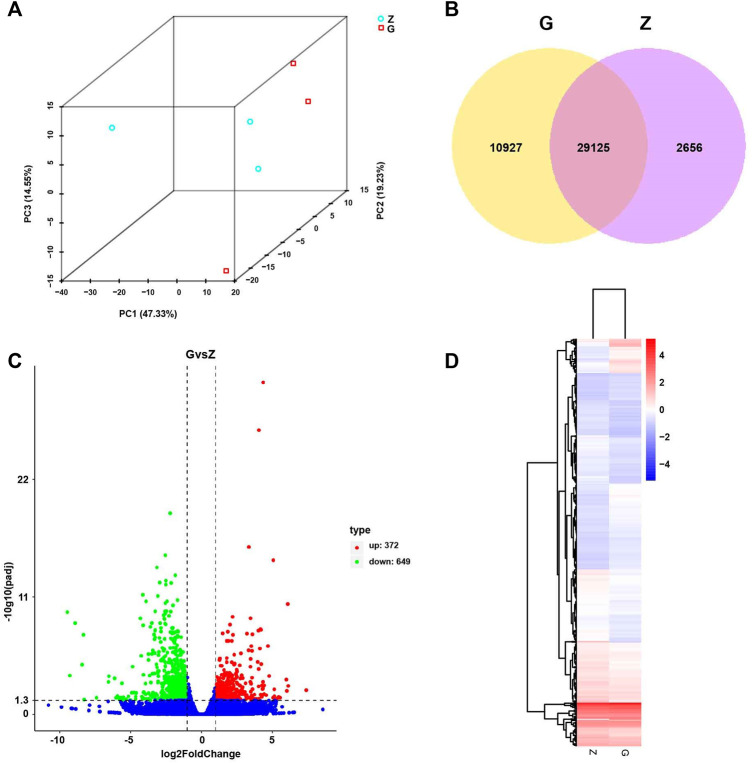
FIGURE 7.
Principal Component Analysis (PCA), Differential Expression (DE) analysis, and Hierarchical Clustering (HC) of fed with high starch diet (G) compared with fed with free-starch diet (Z). (A) PCA analysis of all samples showed a clear separation between group Z and group G along PC1. (B) Venn diagram of unique and shared genes. (C) Volcano plot of differential genes in group G compared with group Z. Red dots represent upregulated genes and green dots represent downregulated genes. (D) Hierarchical clustering (HC) analysis of differential genes in group Z and group G. High expression is shown in red and low expression in blue.

