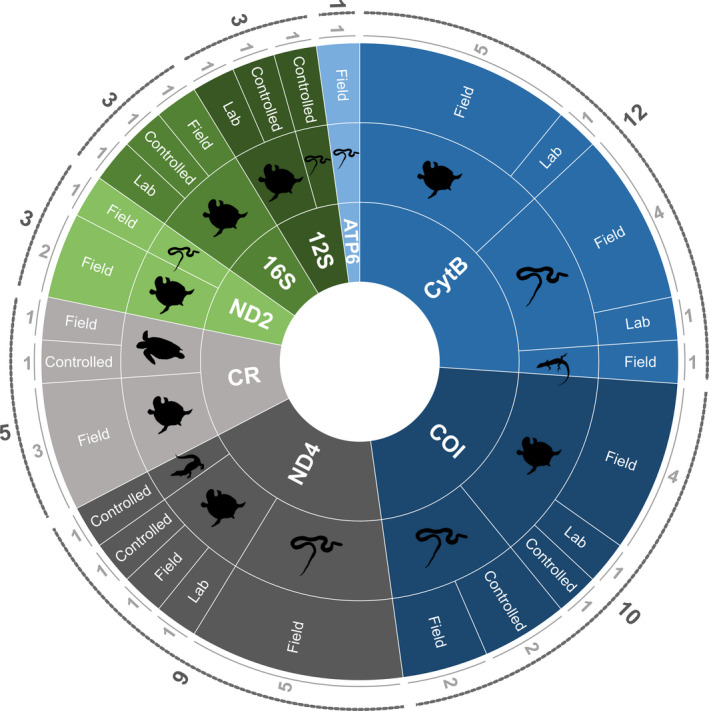
FIGURE 3.

Molecular markers used in reptile species‐specific eDNA studies (inner ring) (CR, control region). Reptile group for each molecular marker is indicated in the middle ring. The outer ring indicates the level of amplification achieved for each reptile group within each molecular marker: Field = studies which successfully amplified the target species under field conditions; Controlled = includes aquaria, terrariums or man‐made enclosures; Lab = target species amplification was achieved in laboratory settings. The numbers on the outer edge indicated the number of studies for each molecular marker, reptile group, and amplification level
