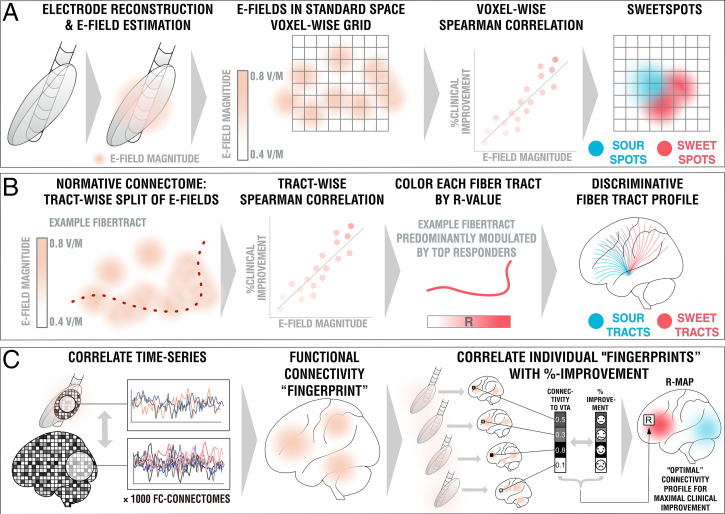
Fig. 2.
Overview of the three methods applied. (A) DBS sweetspot mapping. Based on DBS electrode localizations carried out with Lead-DBS, E-fields were estimated using a finite element approach based on the long-term stimulation parameters applied in each patient. E-fields were then warped into MNI space. For each voxel, the E-field vector magnitudes and clinical improvements were rank-correlated, leading to a map with positive and negative associations (sweet and sour spots). (B) DBS fiber filtering. Again, E-fields were pooled in standard space and the group was set into relationship with all of 26,800 tracts forming a predefined set of normative pathways (17). Sum E-field magnitudes along each tract were aggregated for each patient and again rank-correlated with clinical improvements, attributing positive vs. negative weights to each tract (sweet and sour tracts). (C) DBS network mapping. Seeding blood-oxygen level-dependent signals from each E-field in a database of 1,000 healthy brains led to functional connectivity maps that were averaged to form a functional connectivity “fingerprint” for each patient. Voxels in these were correlated with clinical improvements to create an R-map model of optimal network connectivity.

