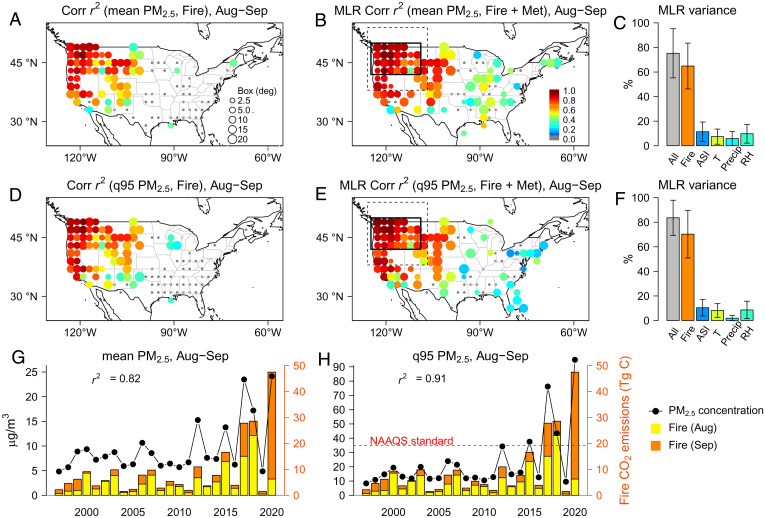
Fig. 1.
Observed correlations between fires and surface PM2.5 air quality. (A–C) Correlation (Corr) r2 of mean PM2.5 averaged over each 2o × 2o grid with regional total CO2 emissions from fires in August (Aug) through September (Sep) during 1997–2020 derived from simple linear regression (A) versus MLR with consideration of meteorological (Met) variables (B) and the variance explained over the US Pacific Northwest (solid black box in B) by each predicting variable (C). The width of the box (in degrees [deg]), within which regional total fire emissions are best correlated with PM2.5 at that site, is given in the right corner in A. The r2 values are color-coded for sites with significant correlations, with gray indicating sites with insignificant correlations (P > 0.05). (D–F) Same as A–C, but for the q95 of available daily PM2.5 observations at each grid in August through September. (G and H) Time series of the mean and q95 PM2.5 in August through September averaged over US Pacific Northwest sites from 1997 to 2020, along with regional total CO2 emissions from fires integrated over western North America (dashed black box in B). Precip, precipitation; RH, relative humidity; T, temperature; ASI, air stagnation index.

