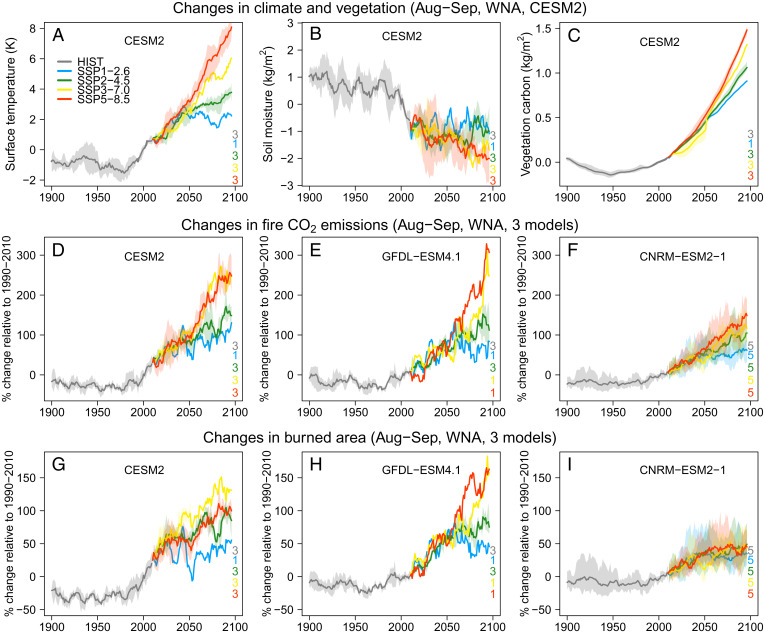
Fig. 4.
Changes in climate and fires during August (Aug) through September (Sep) in the 21st century. Changes in 10-y running average of surface temperature (A), soil moisture in top 10 cm (B), and carbon mass in vegetation (C) relative to the 1990–2010 averages in August through September over western North America (WNA) from CESM2 historical simulations (gray) and future projections (colors) under four SSPs (SI Appendix, Table S1). (D–I) Same as A, but for total fire emissions of CO2 (in percent) (D–F) and burned area (in percent) (G–I) from three CMIP6 Earth System Models: CESM2 (Left), GFDL-ESM4.1 (Center), and CNRM-ESM2-1 (Right). Thick lines represent the multiensemble mean, with shading illustrating the spread of available ensemble members (numbers denoted at the bottom-right corner of each graph).

