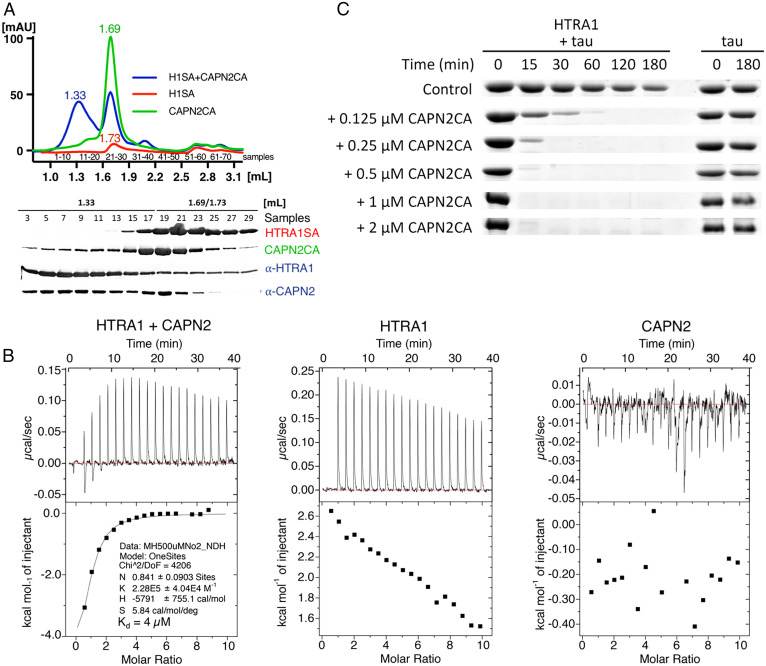
Fig. 1.
Characterization of the HTRA1–CAPN2 complex. (A) Top, size exclusion chromatography. Superdex200 5/150 GL column was used to determine elution profiles of HTRA1SA (H1SA) (red), CAPN2CA (green), and HTRA1SA plus CAPN2CA (blue) (HTRA1SA and CAPN2CA indicate the replacement of the active site Ser or Cys by Ala, respectively). Note that the absorption of HTRA1SA is low because it has no Trp residues. Bottom, sodium dodecylsulfate polyacrylamide gelelectrophoresis of relevant fractions followed by Western blotting. (B) ITC of HTRA1 and CAPN2. ITC measurements were performed to determine the Kd of the binding of CAPN2 to HTRA1 (Left). The individual proteins HTRA1 (Middle) and CAPN2 (Right) were used as controls. 500 µM HTRA1SA was titrated to 10 µM CAPN2CA in 50 mM bicine and 150 mM NaCl pH 9.0 at 37 °C. (C) Dose-dependent activation of HTRA1 by CAPN2CA. 0.5 µM HTRA1 was incubated with 5 µM tau in 50 mM Tris pH 8.0 at 37 °C for the time points indicated in the presence of the CAPN2 concentrations indicated.

