FIGURE 4.

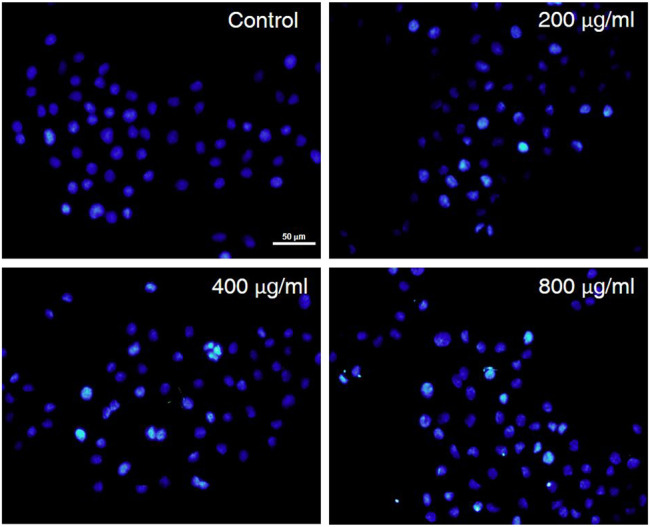
The influence of CCS2 on AGS cell morphology. AGS cells were treated with fluorescent dyes and observed under fluorescence microscopy after treatment without or with CCS2 (0, 200, 400 and 800 μg/ml) for 48 h. Scale bar = 50 μm.

The influence of CCS2 on AGS cell morphology. AGS cells were treated with fluorescent dyes and observed under fluorescence microscopy after treatment without or with CCS2 (0, 200, 400 and 800 μg/ml) for 48 h. Scale bar = 50 μm.