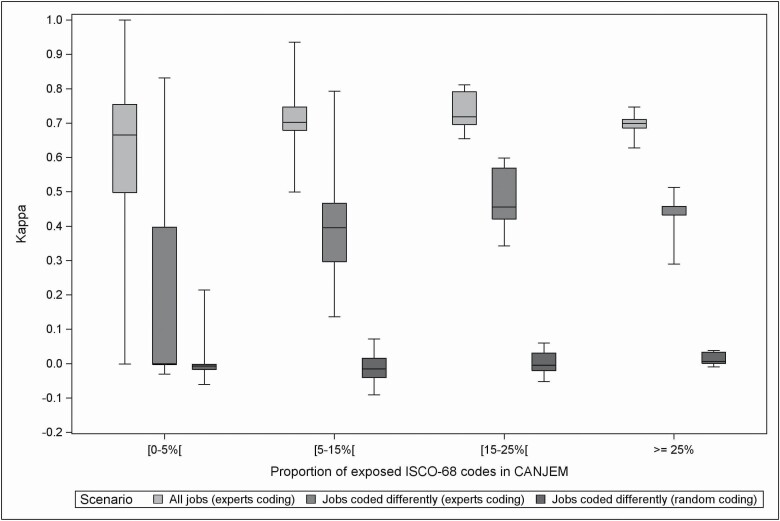
Figure 2.
Distribution of Cohen’s kappa coefficient for exposure status to each of the 258 agents covered by CANJEM (using ISCO-1968 classification and based on 859 informative jobs) according to the proportion of exposed codes and for each scenario. For each boxplot, the following information was provided: minimum, 25th–50th–75th percentiles and maximum. Exposure status was defined according to a 25% threshold of probability of exposure. Numbers of agents retained for each proportion of exposed ISCO-68 codes in CANJEM ([0–5%[/[5–15%[/[15–25%[/≥25%):
Scenario based on all jobs: N = 158/N = 49/N = 8/N = 5.
Scenario based on jobs coded differently (experts coding): N = 147/N = 49/ N = 8/N = 5.
Scenario based on jobs coded differently (random coding): N = 171/N = 49/N = 8/N = 5.

