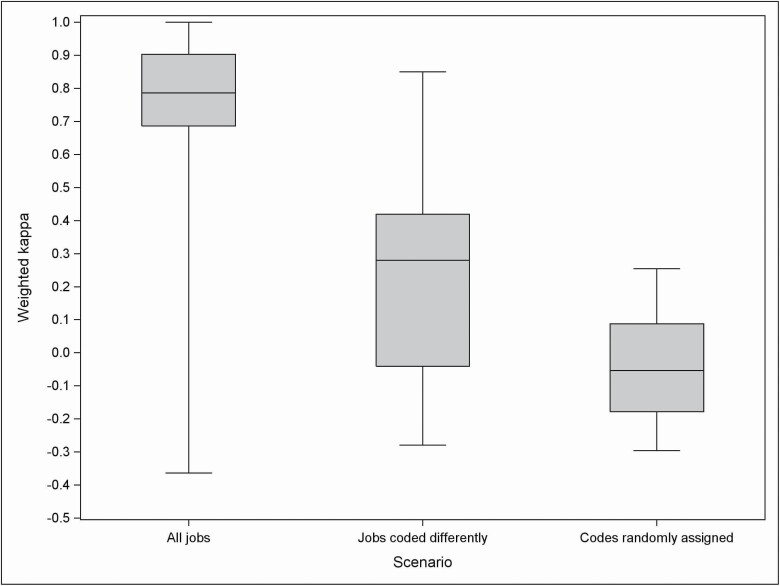
Figure 4.
Distribution of weighted kappa coefficients for intensity of exposure among exposed subjects to each agent covered by CANJEM (using ISCO-1968 classification). For each boxplot, the following information was provided: minimum, 25th–50th–75th percentiles, and maximum. Number of agents retained for the analysis (using a threshold of exposure set at 25%): 96 with the scenario based on all jobs (expert coding), 39 with the scenario based on jobs coded differently (expert coding), and 13 with the scenario based on jobs coded differently (random coding).

