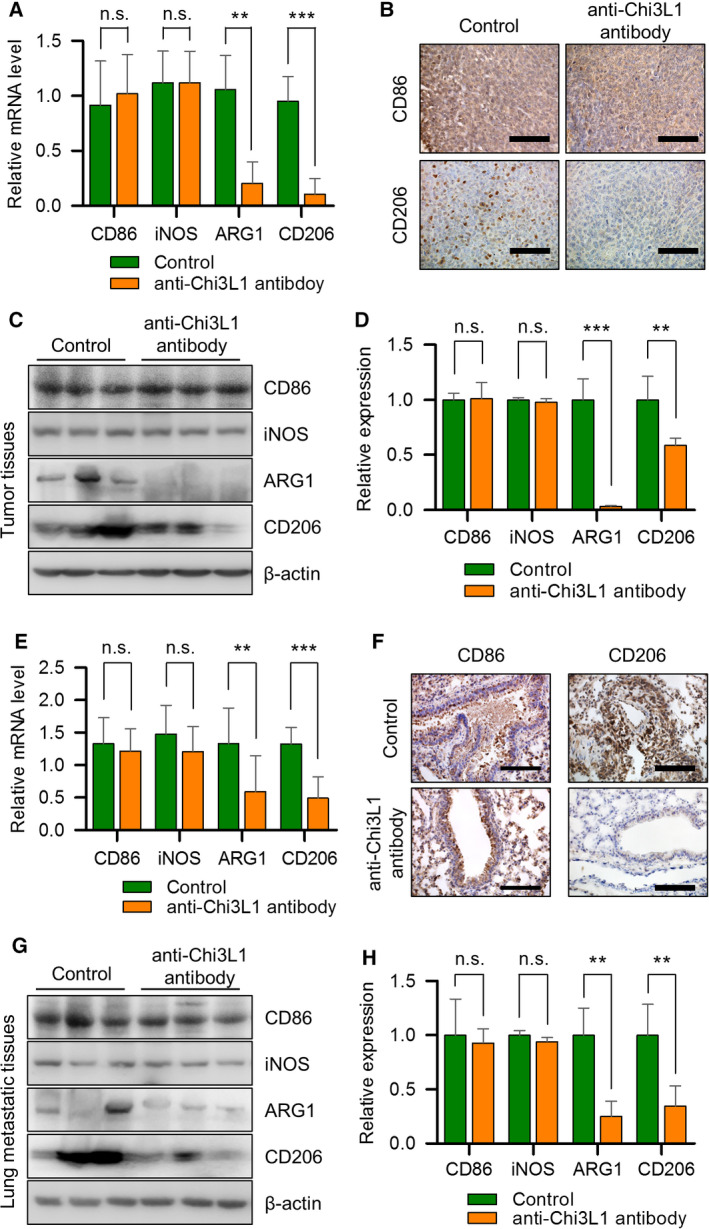
Fig. 4.

Anti‐Chi3L1 antibody inhibits M2‐like polarization in tumors and at metastatic site. (A–D) Lewis lung cancer (LLC) cells were injected subcutaneously to induce lung cancer tumors. Vehicle or anti‐Chi3L1 antibody was injected intravenously twice a week for 4 weeks. (A) Quantitative real‐time PCR analysis of M1‐ (CD86 and iNOS) and M2‐marker (CD206 and ARG1) gene mRNA expression levels in the tumor tissues of each group. Data are presented as mean ± standard deviation (SD) from three independent experiments. **P < 0.01; ***P < 0.001; n.s. (not statistically significant), P > 0.05 (unpaired two‐tailed t‐test). (B) Representative immunohistochemical images of tumor tissues using anti‐CD86 and anti‐CD206 antibodies. Immunohistochemical staining was repeated from three independent experiments. Scale bar, 100 μm. (C) The tumor tissue extracts were subjected to immunoblot analysis with M1‐ and M2‐marker proteins antibodies. (D) The intensity of each band in (C) was measured and the ratio of the amount of each protein to β‐actin was calculated. Data are presented as mean ± standard deviation (SD) from two independent experiments. **P < 0.01; ***P < 0.001; n.s. (not statistically significant), P > 0.05; (unpaired two‐tailed t‐test). (E‐H) A549 cells were injected intravenously into the mice. Anti‐Chi3L1 antibody was injected intravenously twice a week for eight weeks. (E) The real‐time qPCR analysis of M1‐ and M2‐marker gene mRNA expression levels in lung tissues of each group. Data are presented as mean ± standard deviation (SD) from three independent experiments. **P < 0.01; ***P < 0.001; n.s. (not statistically significant), P > 0.05; (unpaired two‐tailed t‐test). (F) Representative immunohistochemical images of lung tissues using anti‐CD86 and anti‐CD206 antibodies. Immunohistochemical staining were repeated from three independent experiments. Scale bar, 100 μm. (G) The lung tissue lysates were subject to immunoblot analysis with M1‐ and M2‐marker proteins antibodies. (H) The intensity of each band in (G) was measured and the ratio of the amount of each protein to β‐actin was calculated. Data are presented as mean ± standard deviation (SD) from two independent experiments. **P < 0.01; n.s. (not statistically significant), P > 0.05; (unpaired two‐tailed t‐test).
