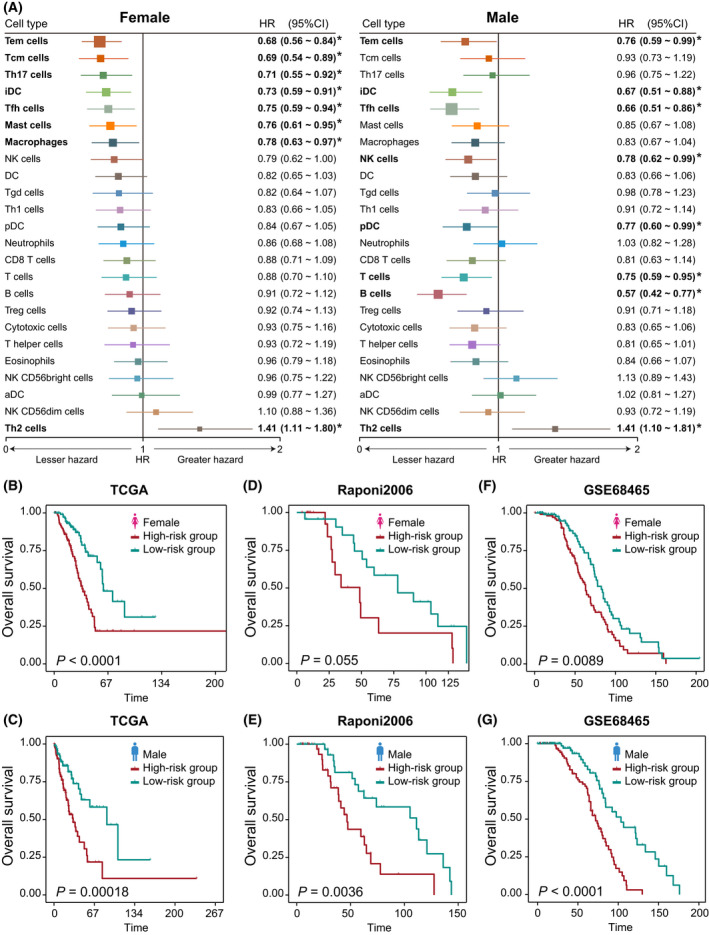
Fig. 7.

Prognostic associations of immune cells in LUAD. (A) Forest plots of the univariate Cox hazard model for overall survival in 190 male and 228 female patients, respectively. HR (boxes) and 95% confidence intervals (horizontal lines) are shown. Box size is inversely proportional to the width of the confidence interval. Asterisks denote estimates with a P‐value < 0.05. Kaplan–Meier survival curves of patients classified into high‐ and low‐risk groups: (B) 228 female patients of TCGA‐LUAD using the female prognostic score model; (C) 190 male patients of TCGA‐LUAD using the male prognostic score model; (D) 46 female patients of Raponi et al. set using the female prognostic score model; (E) 81 male patients of Raponi et al. dataset using the male prognostic score model; (F) 220 female patients of GSE68465 datasets using the female prognostic score model; (G) 223 male patients of GSE68465 datasets using the male prognostic score model. P‐values are calculated by log‐rank test. Vertical hash marks indicate censored data.
