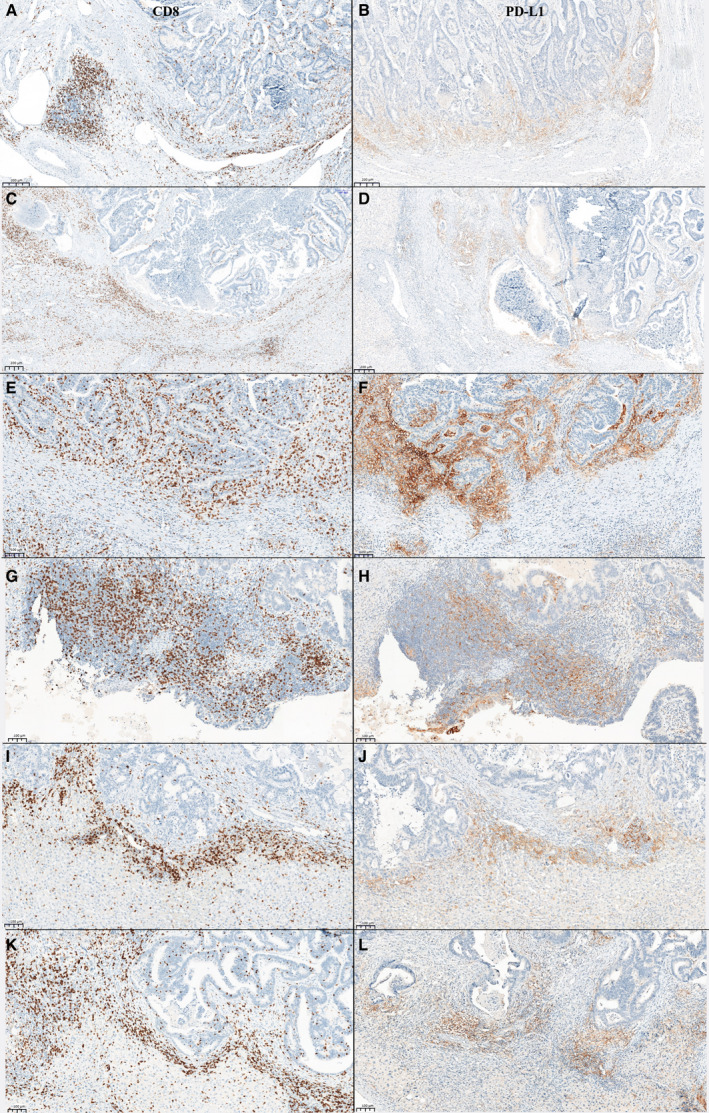
Fig. 1.

Representative images of immunohistochemistry staining of CD8 and PD‐L1. (A) High CD8 expression in the invasive front of the primary tumor, (B) high PD‐L1 expression in the invasive front of the primary tumor of the same patient, (C) high CD8 expression on immune cell in the invasive front of the liver metastasis of the same patient; (D) high PD‐L1 expression on immune cell in the invasive front of the liver metastasis of the same patient, (E) high CD8 expression in the invasive front of a liver metastasis of a second patient, (F) high PD‐L1 expression in the invasive front of a liver metastasis of the same second patient, (G) high CD8 expression in the invasive front of an ovary metastasis of a third patient, (H) high PD‐L1 expression in the invasive front of an ovary metastasis of the same third patient, (I) high CD8 expression in the invasive front of a liver metastasis of a fourth patient, (J) high PD‐L1 expression in the invasive front of a liver metastasis of the same fourth patient, (K) high CD8 expression in the invasive front of a liver metastasis of a fifth patient, (L) high PD‐L1 expression in the invasive front of a liver metastasis of the same fifth patient. Scale bar for A–D = 200 µm. Scale bar for E–L = 100 µm.
