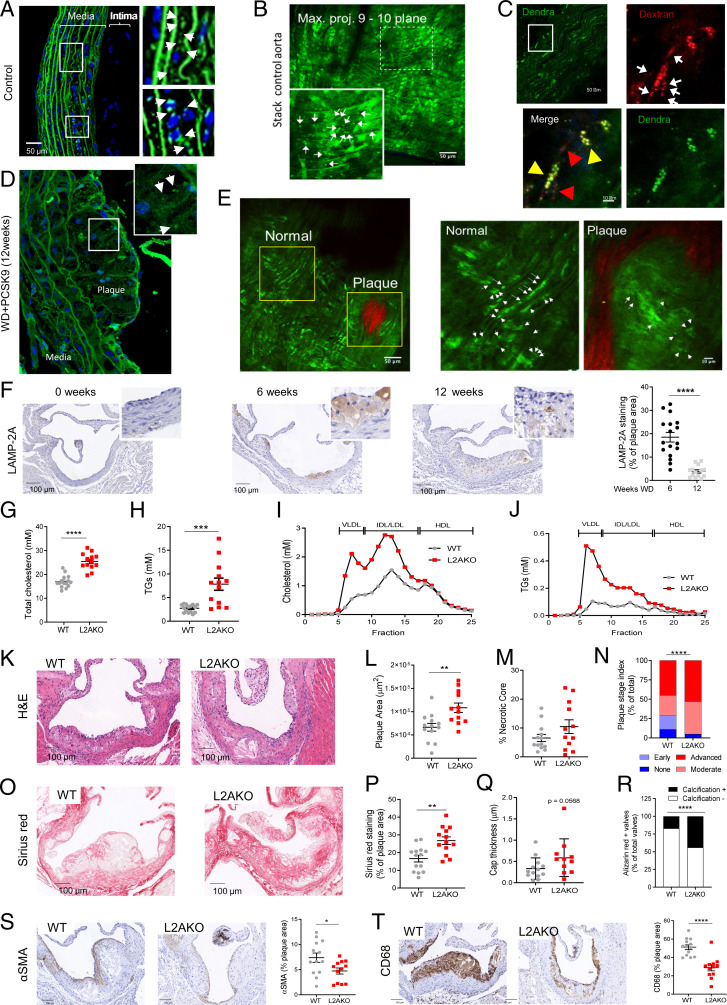
Fig. 1.
CMA deficiency aggravates atherosclerosis in a murine experimental model. (A–E) CMA activity in aorta from KFERQ-Dendra2 mice untreated (Control; A–C) or subjected to a proatherosclerotic treatment (injected with AAV8-PCSK9 and maintained for 12 wk on WD; D and E). (A–E, Insets) Boxed areas at higher magnification. Arrows indicate fluorescent puncta. In C, animals were injected with fluorescent dextran (in red) to highlight endolysosomal compartments. Individual and merged channels of the boxed regions at higher magnification are shown. Arrowheads indicate dextran+Dendra+ puncta (yellow) and dextran+ only puncta (red). Collagen (red) was visualized by second harmonic generation (E). (F) Levels of LAMP-2A at the indicated times of the proatherosclerotic intervention. Representative images of aorta sections (Left) and quantification in the neointima (Right); n = 18. (G–J) Circulating lipids in WT and LAMP-2A–null mice (L2AKO) subjected to the proatherosclerotic challenge for 12 wk. (G–J) Circulating total cholesterol (G), TGs (H), cholesterol profile (I), and TG profile (J). Individual values (G and H) and average curves (I and J) are shown; (n = 15 WT, n = 14 L2AKO). (K–T) Plaque properties in the same mouse groups. Representative images of aortas stained for hematoxylin and eosin (H&E) (K) or sirius red (O) and quantification of plaque area (L), size of the necrotic core (M), plaque stage index (N), sirius red–positive area (P), and cap thickness (Q). Calcification analysis in aortas stained for alizarin red (R) as shown in SI Appendix, Fig. S1I . (S and T) Representative images of aortas immunostained for αSMA (VSMCs) (S) and CD68 macrophages (T) and quantification of the stained area (Right); (n = 13 WT, n = 12 L2AKO). Individual values (symbols) and mean ± SEM are shown. Experiments in A–E were repeated three times with similar results. All data were tested for normal distribution using the D’Agostino and Pearson normality test. Variables that did not pass the normality test were subsequently analyzed using the Mann–Whitney U rank-sum test. All other variables were tested with the Student’s t test. *P < 0.05, **P < 0.01, ***P < 0.005, and ****P < 0.0001.

