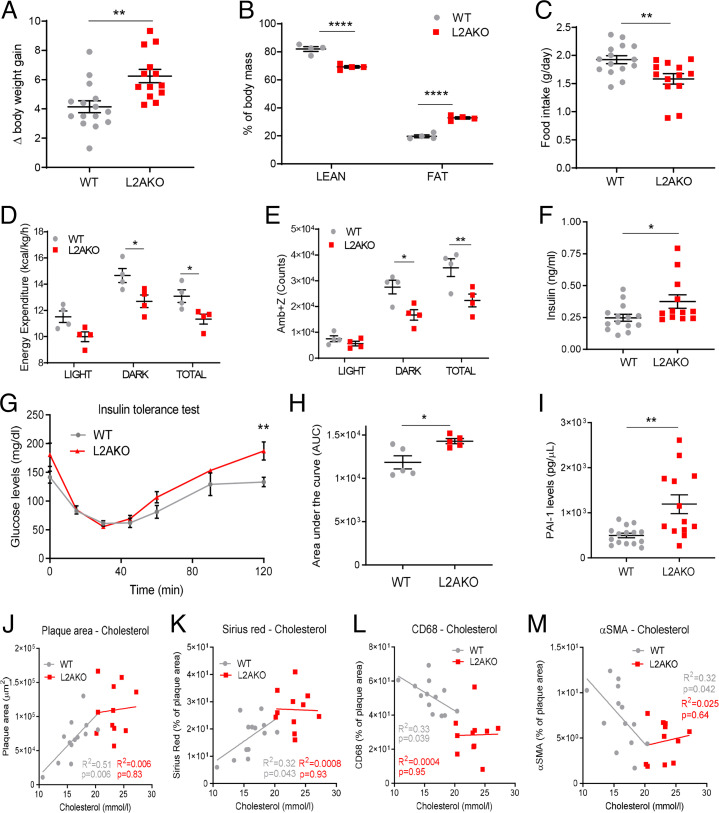
Fig. 2.
Proatherogenic challenge elicits metabolic dysfunction in CMA-deficient mice. (A–E) WT and L2AKO mice subjected to a proatherosclerotic treatment (injected with AAV8-PCSK9 and maintained for 12 wk on WD) were compared for body weight gain (n = 15 WT, n = 14 L2AKO) (A), body composition (n = 4) (two-way ANOVA, F = 120.1; P < 0.0001 for interaction, F = 1736; P < 0.0001 for lean/fat, F = 0.01544; P = 0.9032 for genotype; n = 4) (B), food intake (n = 14 WT, n = 16 L2AKO) (C), energy expenditure (two-way ANOVA, F = 0.1185; P = 0.8889 for interaction, F = 21.05; P < 0.0001 for light/dark/total, F = 22.41; P = 0.0002 for genotype; n = 4) (D), and ambulatory parameters (x + z axes) (two-way ANOVA, F = 3.194; P = 0.0650 for interaction, F = 49.75; P < 0.0001 for light/dark/total, F = 20.75; P = 0.0002 for genotype; n = 4) (E). (F–I) Circulating levels in the same mouse groups of insulin (n = 15 WT, n = 14 L2AKO) (F), glucose during an insulin tolerance test (repeated-measures two-way ANOVA after Bonferroni’s post hoc test, F = 1.851; P = 0.1090 for interaction, F = 31.96; P < 0.0001 for time, F = 15.99; P = 0.0040 for genotype; n = 5) (G), area under the curve from the insulin tolerance test (H), and circulating PAI-1 levels (n = 15 WT, n = 14 L2AKO) (I). (J–M) Correlation between plasma cholesterol and different plaque parameters: plaque area (J), collagen (K), macrophages (L), and % VSMC of plaque area (M) in the same mouse groups (n = 15 WT, n = 14 L2AKO). All data, when applicable, were tested for normal distribution using the D’Agostino and Pearson normality test. Variables that did not pass the normality test were subsequently analyzed using the Mann–Whitney U rank-sum test. All other variables were tested with the Student’s t test. Individual values (symbols) and mean ± SEM are shown. *P < 0.05, **P < 0.01, and ****P < 0.001.

