Fig. 6.
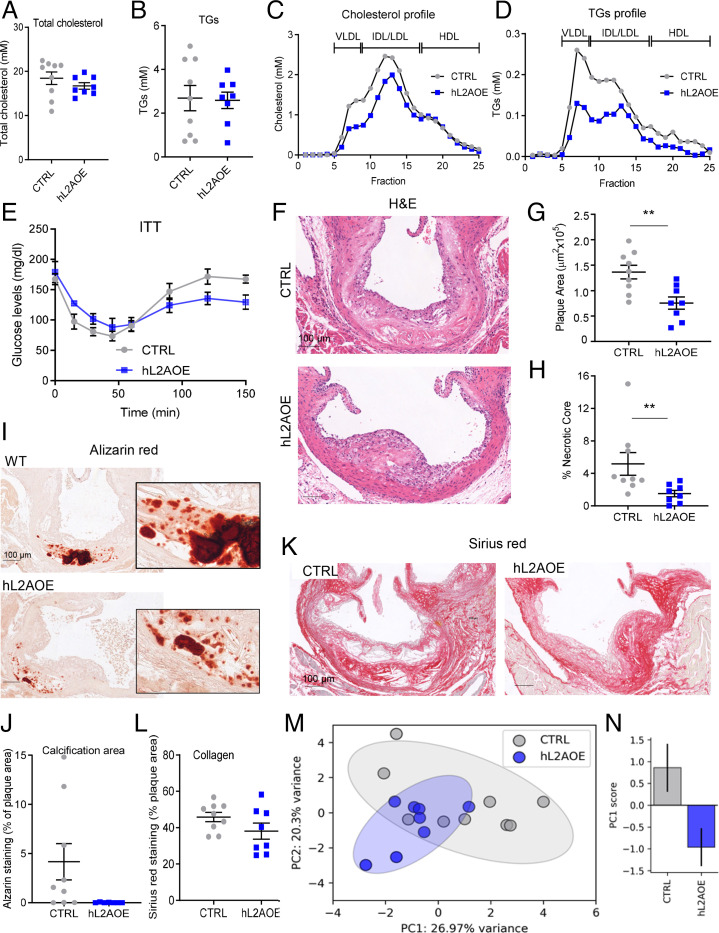
Genetic up-regulation of CMA ameliorates disease in an atherosclerosis murine experimental model. (A–D) Circulating lipids in control mice (CTRL) and in mice systemically expressing a copy of human LAMP-2A (hL2AOE) subjected to a proatherosclerotic intervention (injected with AAV8-PCSK9 and maintained for 12 wk on WD). Circulating total cholesterol (A), TGs (B), cholesterol profile (C), and TG profile (D); n = 9 CTRL, n = 8 hL2AOE. IDL, intermediate density LDL. (E) Insulin tolerance test in the same mice (repeated-measures two-way ANOVA after Bonferroni’s post hoc test, F = 3.159; P = 0.0047 for interaction, F = 21.02; P < 0.0001 for time, F = 1.578; P = 0.098 for genotype) in the same mice. (F–L) Properties of the plaques from aortas of the same mouse groups. Representative images of aortas stained for H&E (F), alizarin red (I), or sirius red (K) and quantification of plaque area (G), size of the necrotic core (H), calcification presence (J), and collagen deposition (L); n = 9 CTRL, n = 8 hL2AOE. (M and N) Principal-component (PC) analysis of 12 variables measured in CTRL and hL2AOE mice. Each dot represents a single animal (M). Ellipses are the 95% CI around the center of mass of a given experimental group. The bar plot represents mean ± SEM of the PC1 score for each experimental group (N); n = 9 CTRL, n = 8 hL2AOE. *Student’s t test between CTRL and hL2AOE, t15 = 2.152, P = 0.048. Individual values and mean ± SEM are presented in all quantifications. All data were tested for normal distribution using the D’Agostino and Pearson normality test. Variables that did not pass the normality test were subsequently analyzed using the Mann–Whitney U rank-sum test. All other variables were tested with the Student’s t test. **P < 0.01.

