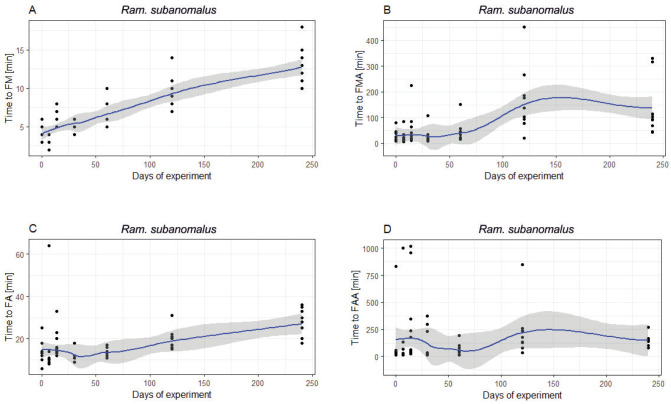
Fig. 5.
Relationship between the measured activity indices and time spent during the tun stage for Ramazzottius subanomalus: (A) time to first movement of any first individuals (FM); (B) time to first movement of all individuals (FAA); (C) time to full activity of any first individual (FA); (D) time to full activity of all individuals (FAA). Curves ± SE were fitted with Local Polynomial Regression Fitting (LOESS).

